第45章個体群と群集の生態学
45.3 Environmental Limits to Population Growth45.3 個体群増加に対する環境の制限
Learning Objectives学習目標
By the end of this section, you will be able to do the following:
この節を学ぶと、次のことができるようになる。
- Explain the characteristics of and differences between exponential and logistic growth patterns指数増加とロジスティック増加の特徴と違いを説明する。
- Give examples of exponential and logistic growth in natural populations自然個体群での指数増加とロジスティック増加の例を挙げる。
- Describe how natural selection and environmental adaptation led to the evolution of particular life history patterns自然選択と環境への適応が、特定の生活史パターンの進化につながった過程を説明する。
Although life histories describe the way many characteristics of a population (such as their age structure) change over time in a general way, population ecologists make use of a variety of methods to model population dynamics mathematically. These more precise models can then be used to accurately describe changes occurring in a population and better predict future changes. Certain long-accepted models are now being modified or even abandoned due to their lack of predictive ability, and scholars strive to create effective new models.
英語のヒント
生活史は、齢構成など個体群の多くの特徴が時間とともにどう変わるかを、一般的に記述する。一方、個体群生態学者は、さまざまな方法で個体群動態を数学的にモデル化する。より精密なモデルを使えば、個体群内で起こる変化を正確に記述し、将来の変化をよりよく予測できる。長く受け入れられてきたモデルの中にも、予測能力が不足するため修正され、あるいは放棄されるものがあり、研究者は有効な新しいモデルを作ろうとしている。
Exponential Growth指数増加
Charles Darwin, in his theory of natural selection, was greatly influenced by the English clergyman Thomas Malthus. Malthus published a book in 1798 stating that populations with unlimited natural resources grow very rapidly, which represents an exponential growth, and then population growth decreases as resources become depleted, indicating a logistic growth.
英語のヒント
チャールズ・ダーウィンの自然選択説は、英国の聖職者トマス・マルサスから大きな影響を受けた。マルサスは1798年の著書で、自然資源が無制限なら個体群は非常に速く増える、すなわち指数増加を示すと述べた。そして資源が枯渇すると増加は鈍り、ロジスティック増加を示す。
The best example of exponential growth is seen in bacteria. Bacteria reproduce by prokaryotic fission. This division takes about an hour for many bacterial species. If 1000 bacteria are placed in a large flask with an unlimited supply of nutrients (so the nutrients will not become depleted), after an hour, there is one round of division and each organism divides, resulting in 2000 organisms—an increase of 1000. In another hour, each of the 2000 organisms will double, producing 4000, an increase of 2000 organisms. After the third hour, there should be 8000 bacteria in the flask, an increase of 4000 organisms. The important concept of exponential growth is the accelerating population growth rate—the number of organisms added in each reproductive generation—that is, it is increasing at a greater and greater rate. After 1 day and 24 of these cycles, the population would have increased from 1000 to more than 16 billion. When the population size, N, is plotted over time, a J-shaped growth curve is produced (Figure 45.9).
英語のヒント
指数増加の最も分かりやすい例は細菌である。細菌は原核生物の分裂によって増える。多くの種では1回の分裂に約1時間かかる。栄養物質を無制限に供給し、枯渇しない大きなフラスコへ1,000個体を入れると、1時間後には全個体が一度分裂し、1,000個体増えて2,000個体になる。さらに1時間後には、2,000個体がそれぞれ分裂して2,000個体増え、4,000個体になる。3時間後にはさらに4,000個体増え、8,000個体となるはずである。指数増加の重要な考え方は、個体群の増加速度、つまり繁殖世代ごとに加わる個体数が加速することである。増え方が次第に大きくなる。1日、すなわち24回の周期の後には、1,000個体から160億個体以上になる。個体群サイズNを時間に対して描くと、J字型の増殖曲線ができる(図45.9)。
The bacteria example is not representative of the real world where resources are limited. Furthermore, some bacteria will die during the experiment and thus not reproduce, lowering the growth rate. Therefore, when calculating the growth rate of a population, the death rate (D) (number organisms that die during a particular time interval) is subtracted from the birth rate (B) (number organisms that are born during that interval). This is shown in the following formula:
英語のヒント
この細菌の例は、資源に限りのある現実を代表してはいない。さらに、実験中に一部の細菌は死んで繁殖しないため、増加速度は低くなる。したがって、個体群の増加速度を計算するときは、出生率B(ある時間区間に生まれる個体数)から死亡率D(同じ区間に死ぬ個体数)を引く。次の式で表される。
The birth rate is usually expressed on a per capita (for each individual) basis. Thus, B (birth rate) = bN (the per capita birth rate “b” multiplied by the number of individuals “N”) and D (death rate) = dN (the per capita death rate “d” multiplied by the number of individuals “N”). Additionally, ecologists are interested in the population at a particular point in time, an infinitely small time interval. For this reason, the terminology of differential calculus is used to obtain the “instantaneous” growth rate, replacing the change in number and time with an instant-specific measurement of number and time.
英語のヒント
出生率は通常、個体当たりで表す。したがって、B(出生率)=bN(個体当たりの出生率bと個体数Nの積)、D(死亡率)=dN(個体当たりの死亡率dと個体数Nの積)となる。また、生態学者は、特定の時点、すなわち無限に短い時間区間での個体群にも関心をもつ。このため微分の表記を使い、個体数と時間の変化を瞬間ごとの測定に置き換え、「瞬間的」な増加速度を求める。
Notice that the “d” associated with the first term refers to the derivative (as the term is used in calculus) and is different from the death rate, also called “d.” The difference between birth and death rates is further simplified by substituting the term “r” (intrinsic rate of increase signifying the maximum per capita growth rate under ideal conditions) for the relationship between birth and death rates:
英語のヒント
第1項にあるdは、微分で用いる導関数に関わる記号であり、同じdで表す死亡率とは異なることに注意しよう。出生率と死亡率の差は、両者の関係をr(理想条件下での個体当たりの最大増加率を示す、内的自然増加率)に置き換えることで、さらに簡単に表せる。
The value “r” can be positive, meaning the population is increasing in size; or negative, meaning the population is decreasing in size; or zero, where the population’s size is unchanging, a condition known as zero population growth. A further refinement of the formula recognizes that different species have inherent differences in their intrinsic rate of increase (often thought of as the potential for reproduction), even under ideal conditions. Obviously, a bacterium can reproduce more rapidly and have a higher intrinsic rate of growth than a human. The maximal growth rate for a species is its biotic potential, or rmax, thus changing the equation to:
英語のヒント
rが正なら個体群は増加し、負なら減少し、0なら個体群サイズは変わらない。この最後の状態を、個体群のゼロ成長という。式をさらに精密にすると、理想条件下でも種によって内的自然増加率が異なることを考慮できる。この率は、繁殖の潜在能力と考えられることが多い。明らかに細菌は人間より速く繁殖でき、内的自然増加率が高い。種の最大増加率を繁殖ポテンシャル、またはrmaxといい、式は次のようになる。
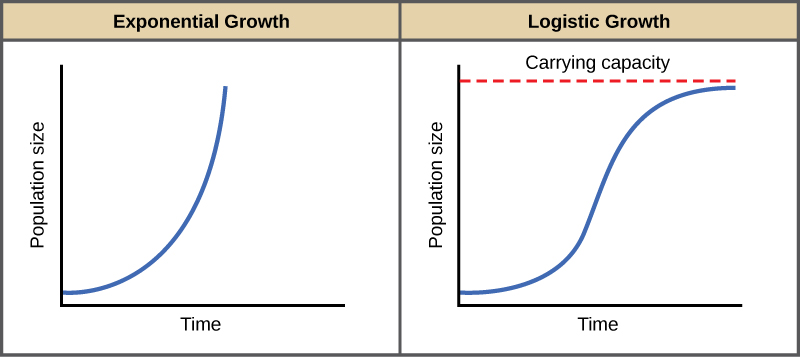

Figure 45.9図 45.9
When resources are unlimited, populations exhibit exponential growth, resulting in a J-shaped curve. When resources are limited, populations exhibit logistic growth. In logistic growth, population expansion decreases as resources become scarce, and it levels off when the carrying capacity of the environment is reached, resulting in an S-shaped curve.
資源が無制限なら個体群は指数増加し、J字型の曲線を描く。資源が限られる場合はロジスティック増加となる。資源が乏しくなるにつれて増加が鈍り、環境収容力に達すると横ばいになるため、S字型の曲線となる。