第45章個体群と群集の生態学
Survivorship Curves生存曲線
Another tool used by population ecologists is a survivorship curve, which is a graph of the number of individuals surviving at each age interval plotted versus time (usually with data compiled from a life table). These curves allow us to compare the life histories of different populations (Figure 45.6). Humans and most primates exhibit a Type I survivorship curve because a high percentage of offspring survive their early and middle years—death occurs predominantly in older individuals. These types of species usually have small numbers of offspring at one time, and they give a high amount of parental care to them to ensure their survival. Birds are an example of an intermediate or Type II survivorship curve because birds die more or less equally at each age interval. These organisms also may have relatively few offspring and provide significant parental care. Trees, marine invertebrates, and most fishes exhibit a Type III survivorship curve because very few of these organisms survive their younger years; however, those that make it to an old age are more likely to survive for a relatively long period of time. Organisms in this category usually have a very large number of offspring, but once they are born, little parental care is provided. Thus these offspring are “on their own” and vulnerable to predation, but their sheer numbers assure the survival of enough individuals to perpetuate the species.
英語のヒント
個体群生態学者が用いるもう1つの手法が、生存曲線である。各年齢区間で生き残っている個体数を、時間に対して示すグラフで、通常は生命表のデータから作る。これにより、異なる個体群の生活史を比較できる(図45.6)。人間と多くの霊長類はI型を示す。幼若期から中年期まで高い割合で生き残り、主に高齢で死亡するためである。この型の種は、一度に産む子が通常少なく、生存を確保するため手厚く世話をする。鳥類は中間のII型の例で、どの年齢区間でもほぼ同じ割合で死ぬ。これらも子の数が比較的少なく、親が十分に世話する場合がある。樹木、海産無脊椎動物、多くの魚類はIII型を示す。若い時期を生き延びる個体は非常に少ないが、ある程度の年齢まで達すれば、比較的長く生きる可能性が高い。この型は通常、非常に多くの子を生むが、生まれた後の世話はほとんどしない。子は「自力で」暮らし、捕食されやすい。それでも、圧倒的な数によって、種を存続させるのに十分な個体が生き残る。
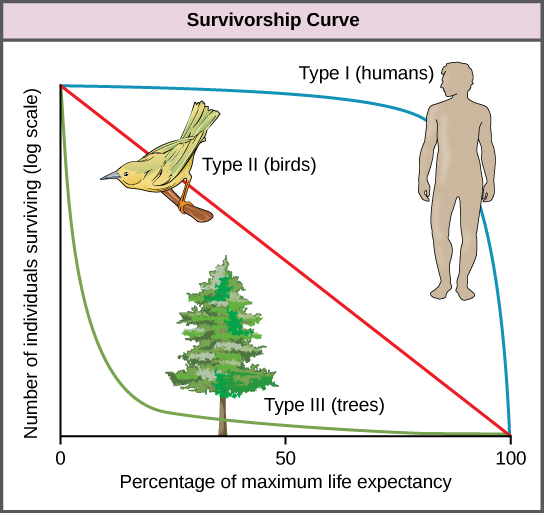

Figure 45.6図 45.6
Survivorship curves show the distribution of individuals in a population according to age. Humans and most mammals have a Type I survivorship curve because death primarily occurs in the older years. Birds have a Type II survivorship curve, as death at any age is equally probable. Trees have a Type III survivorship curve because very few survive the younger years, but after a certain age, individuals are much more likely to survive.
生存曲線は、個体群内の個体の年齢に応じた分布を示す。人間と多くの哺乳類は、主に高齢で死ぬためI型となる。鳥類はどの年齢でも死亡確率が等しいためII型となる。樹木は若い時期を生き延びるものが少ないが、ある年齢を過ぎれば生存しやすくなるためIII型となる。
Section Summaryこの節のまとめ
Populations are individuals of a species that live in a particular habitat. Ecologists measure characteristics of populations: size, density, dispersion pattern, age structure, and sex ratio. Life tables are useful to calculate life expectancies of individual population members. Survivorship curves show the number of individuals surviving at each age interval plotted versus time.
個体群は、特定の生息地に暮らす、同じ種の個体からなる。生態学者は、個体群サイズ、密度、分散様式、齢構成、性比を測定する。生命表は各個体の平均余命の計算に役立つ。生存曲線は、各年齢区間で生き残る個体数を時間に対して示す。
Visual Connection Questions図を使った問題
Exercises 1練習問題 1
Exercise 1問題 1
Figure 45.2 As this graph shows, population density typically decreases with increasing body size. Why do you think this is the case?
図45.2 このグラフのように、一般に体が大きくなるほど個体群密度は低下する。なぜだと考えられるか。
Solution解き方
Figure 45.2 Smaller animals require less food and other resources, so the environment can support more of them.
図45.2 小さな動物は必要な食料やその他の資源が少ないため、環境はより多くの個体を支えられる。
Review Questions確認問題
Exercises 2–5練習問題 2–5
Exercise 2問題 2
Which of the following methods will tell an ecologist about both the size and density of a population?
次の方法のうち、個体群のサイズと密度の両方が分かるものはどれか。
- mark and recapture標識再捕法
- mark and release標識放逐法
- quadrat方形区
- life table生命表
Solution解き方
C
C
Exercise 3問題 3
Which of the following is best at showing the life expectancy of an individual within a population?
個体群内の個体の平均余命を示すのに、最も適しているものはどれか。
- quadrat方形区
- mark and recapture標識再捕法
- survivorship curve生存曲線
- life table生命表
Solution解き方
D
D
Exercise 4問題 4
Humans have which type of survivorship curve?
人間は、どの型の生存曲線を示すか。
- Type II型
- Type IIII型
- Type IIIIII型
- Type IVIV型
Solution解き方
A
A
Exercise 5問題 5
How is a clumped population distribution beneficial for prey animals?
集中分布は、被食動物にどのような利益をもたらすか。
- Being a member of a larger group provides protection for each individual from predators.大きな集団の一員になることで、各個体が捕食者から守られる。
- Prey animals rely on each other to acquire food.被食動物は、食料を得るため互いに頼り合う。
- Prey animals live in small family groups to raise young.被食動物は、子を育てるため小さな家族集団で暮らす。
- Clumped population distributions ensure that at least one member of the population knows how to identify the seasonal migration route.集中分布なら、個体群の少なくとも1個体は、季節移動の経路を見分ける方法を知っていることになる。
Solution解き方
A
A
Critical Thinking Questions考察問題
Exercises 6–7練習問題 6–7
Exercise 6問題 6
Describe how a researcher would determine the size of a penguin population in Antarctica using the mark and release method.
標識放逐法を使って、南極のペンギンの個体群サイズを求める手順を説明しなさい。
Solution解き方
The researcher would mark a certain number of penguins with a tag, release them back into the population, and, at a later time, recapture penguins to see what percentage of the recaptured penguins was tagged. This percentage would allow an estimation of the size of the penguin population.
一定数のペンギンに標識を付けて個体群へ戻し、後日、ペンギンを再捕獲して、標識のある個体の割合を調べる。その割合から、個体群サイズを推定できる。
Exercise 7問題 7
The CDC released the following data in its 2013 Vital Statistics report.
CDCは、2013年の人口動態統計報告で、次のデータを公表した。
Age interval 年齢区間 |
Number dying in age interval 年齢区間内の死亡数 |
Number surviving at beginning of age interval 年齢区間の開始時の生存数 |
0-10 |
756 |
100,000 |
11-20 |
292 |
99,244 |
21-30 |
890 |
98,953 |
31-40 |
1,234 |
98,164 |
41-50 |
2,457 |
96,811 |
51-60 |
5,564 |
94,352 |
61-70 |
10,479 |
88,788 |
Calculate the mortality rate for each age interval, and describe the trends in adult and childhood mortality per 100,000 births in the United States in 2013.
各年齢区間の死亡率を計算し、2013年の米国における出生10万当たりの成人期・小児期の死亡の傾向を説明しなさい。
Solution解き方
Mortality is calculated as [(Number Dying)/(Number Surviving)] x 1000 so the completed life table should read:
死亡率は[死亡数/生存数]×1,000で計算するため、完成した生命表は次のようになる。
Age interval 年齢区間 |
Number dying in age interval 年齢区間内の死亡数 |
Number surviving at beginning of age interval 年齢区間の開始時の生存数 |
Mortality rate 死亡率 |
0-10 |
756 |
100,000 |
7.56 |
11-20 |
292 |
99,244 |
2.94 |
21-30 |
890 |
98,953 |
8.99 |
31-40 |
1,234 |
98,164 |
12.6 |
41-50 |
2,457 |
96,811 |
25.4 |
51-60 |
5,564 |
94,352 |
58.97 |
61-70 |
10,479 |
88,788 |
118.0 |
The table shows that mortality is high among very young children Americans (under age 10), then falls for teens and young adults. Mortality starts rising again in middle age, nearly doubling from the 50s to the 60s.
この表では、米国の幼い子ども(10歳未満)の死亡率が高く、10代と若い成人では低下している。中年期から再び上がり始め、50代から60代にかけてほぼ2倍になる。
demography
個体群統計学
statistical study of changes in populations over time
時間とともに起こる個体群の変化の統計的研究。
life table
生命表
table showing the life expectancy of a population member based on its age
個体群の個体について、年齢に基づく平均余命を示す表。
mark and recapture
標識再捕法
technique used to determine population size in mobile organisms
移動する生物の個体群サイズを求める手法。
mortality rate
死亡率
proportion of population surviving to the beginning of an age interval that die during the age interval
年齢区間の開始時に生存する個体のうち、その区間内に死ぬ割合。
population density
個体群密度
number of population members divided by the area or volume being measured
個体群の個体数を、測定対象の面積または体積で割った値。
population size (N)
個体群サイズ(N)
number of population members in a habitat at the same time
ある時点で、生息地内にいる個体群の個体数。
quadrat
方形区
square made of various materials used to determine population size and density in slow moving or stationary organisms
さまざまな材質で作る正方形の枠。動きの遅い生物や動かない生物の個体群サイズと密度を求める。
species dispersion pattern
種の分散様式
(also, species distribution pattern) spatial location of individuals of a given species within a habitat at a particular point in time
分布様式ともいう。ある時点の生息地内で、特定の種の個体が占める空間的位置。
survivorship curve
生存曲線
graph of the number of surviving population members versus the relative age of the member
個体の相対的な年齢に対して、個体群内の生存個体数を示すグラフ。