第45章個体群と群集の生態学
Species Distribution種の分布
In addition to measuring simple density, further information about a population can be obtained by looking at the distribution of the individuals. Species dispersion patterns (or distribution patterns) show the spatial relationship between members of a population within a habitat at a particular point in time. In other words, they show whether members of the species live close together or far apart, and what patterns are evident when they are spaced apart.
英語のヒント
単純な密度の測定に加え、個体の分布を見ると、個体群についてさらに情報が得られる。分散様式(分布様式)は、ある時点の生息地内で、個体群の成員どうしがどのような空間的位置関係にあるかを示す。言い換えると、同じ種の個体が密集して暮らすのか、離れているのか、また離れている場合にどのようなパターンが見られるかを表す。
Individuals in a population can be equally spaced apart, dispersed randomly with no predictable pattern, or clustered in groups. These are known as uniform, random, and clumped dispersion patterns, respectively (Figure 45.5). Uniform dispersion is observed in plants that secrete substances inhibiting the growth of nearby individuals (such as the release of toxic chemicals by the sage plant Salvia leucophylla, a phenomenon called allelopathy) and in animals like the penguin that maintain a defined territory. An example of random dispersion occurs with dandelion and other plants that have wind-dispersed seeds that germinate wherever they happen to fall in a favorable environment. A clumped dispersion may be seen in plants that drop their seeds straight to the ground, such as oak trees, or in animals that live in groups (schools of fish or herds of elephants). Clumped dispersions may also be a function of habitat heterogeneity. Thus, the dispersion of the individuals within a population provides more information about how they interact with each other than does a simple density measurement. Just as lower density species might have more difficulty finding a mate, solitary species with a random distribution might have a similar difficulty when compared to social species clumped together in groups.
英語のヒント
個体群の個体は、等間隔に分布したり、予測可能なパターンなしに無作為に散らばったり、集団として固まったりする。これらはそれぞれ、一様分布、ランダム分布、集中分布と呼ばれる(図45.5)。一様分布は、近くの個体の成長を妨げる物質を分泌する植物や、決まった縄張りを保つペンギンのような動物に見られる。例えばセージの一種Salvia leucophyllaは有毒な化学物質を放出する。この現象をアレロパシーという。ランダム分布の例には、タンポポなど、風で散布された種子が適した環境に落ちた場所で発芽する植物がある。集中分布は、オークのように種子を真下へ落とす植物や、魚やゾウの群れのように集団で暮らす動物に見られる。生息地が不均一であることによって生じる場合もある。このように、個体の分布は、単純な密度測定よりも、個体間の関わりについて多くの情報を与える。低密度の種で繁殖相手を見つけにくくなるのと同様に、ランダムに分布する単独性の種も、集団で固まる社会性の種に比べて、同じような困難を抱えうる。
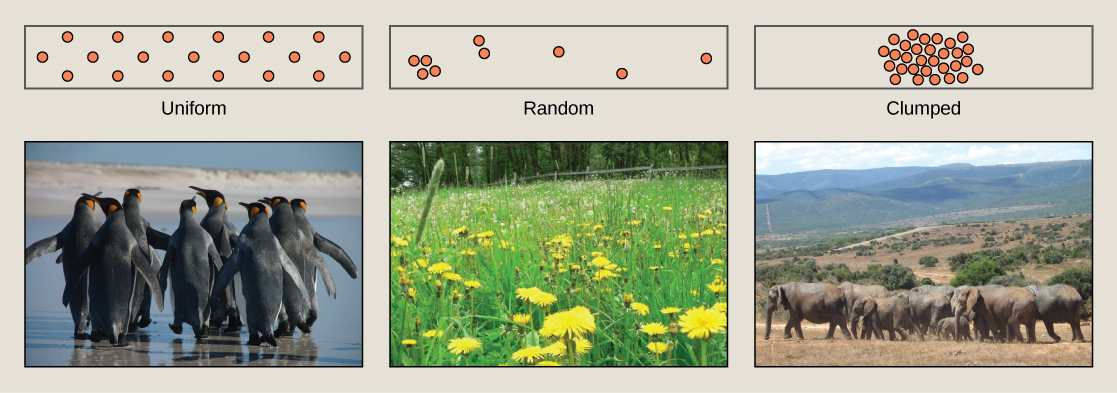
OpenStax, Rice University; Biology 2e. (credit a: modification of work by Ben Tubby; credit b: modification of work by Rosendahl; credit c: modification of work by Rebecca Wood) · CC BY 4.0 · Source出典

Figure 45.5図 45.5
Species may have uniform, random, or clumped distribution. Territorial birds such as penguins tend to have uniform distribution. Plants such as dandelions with wind-dispersed seeds tend to be randomly distributed. Animals such as elephants that travel in groups exhibit clumped distribution. (credit a: modification of work by Ben Tubby; credit b: modification of work by Rosendahl; credit c: modification of work by Rebecca Wood)
種は、一様分布、ランダム分布、集中分布を示す。ペンギンのように縄張りをもつ鳥は、一様に分布する傾向がある。タンポポのように種子が風で散布される植物は、ランダムに分布しやすい。ゾウのように集団で移動する動物は、集中分布を示す。(出典:a:Ben Tubby、b:Rosendahl、c:Rebecca Woodの各作品を改変)
Demography個体群統計学
While population size and density describe a population at one particular point in time, scientists must use demography to study the dynamics of a population. Demography is the statistical study of population changes over time: birth rates, death rates, and life expectancies. Each of these measures, especially birth rates, may be affected by the population characteristics described above. For example, a large population size results in a higher birth rate because more potentially reproductive individuals are present. In contrast, a large population size can also result in a higher death rate because of competition, disease, and the accumulation of waste. Similarly, a higher population density or a clumped dispersion pattern results in more potential reproductive encounters between individuals, which can increase birth rate. Lastly, a female-biased sex ratio (the ratio of males to females) or age structure (the proportion of population members at specific age ranges) composed of many individuals of reproductive age can increase birth rates.
英語のヒント
個体群サイズと密度は、ある1時点での個体群を記述する。一方、その動態を研究するには個体群統計学を使う必要がある。これは、出生率、死亡率、平均余命など、時間とともに起こる個体群の変化を統計的に研究する分野である。各指標、特に出生率は、先に述べた個体群の特徴の影響を受けうる。例えば個体群が大きければ、繁殖可能な個体が多いため出生率が高くなる。一方、競争、病気、老廃物の蓄積によって、死亡率も高くなりうる。同様に、密度が高い場合や集中分布の場合、繁殖につながる個体間の出会いが増え、出生率が上がることがある。最後に、性比(雄と雌の比率)が雌に偏っている場合や、齢構成(各年齢範囲の個体の割合)に繁殖年齢の個体が多い場合も、出生率が上がりうる。
In addition, the demographic characteristics of a population can influence how the population grows or declines over time. If birth and death rates are equal, the population remains stable. However, the population size will increase if birth rates exceed death rates; the population will decrease if birth rates are less than death rates. Life expectancy is another important factor; the length of time individuals remain in the population impacts local resources, reproduction, and the overall health of the population. These demographic characteristics are often displayed in the form of a life table.
英語のヒント
個体群の統計的特性は、時間とともに個体群がどう増減するかにも影響する。出生率と死亡率が等しければ、個体群は安定する。出生率が死亡率を上回れば個体群サイズは増え、下回れば減る。平均余命も重要な要因である。個体が個体群内にとどまる期間は、地域の資源、繁殖、個体群全体の健全性に影響する。こうした統計的特性は、生命表の形で示されることが多い。
Life Tables生命表
Life tables provide important information about the life history of an organism. Life tables divide the population into age groups and often sexes, and show how long a member of that group is likely to live. They are modeled after actuarial tables used by the insurance industry for estimating human life expectancy. Life tables may include the probability of individuals dying before their next birthday (i.e., their mortality rate), the percentage of surviving individuals dying at a particular age interval, and their life expectancy at each interval. An example of a life table is shown in Table 45.1 from a study of Dall mountain sheep, a species native to northwestern North America. Notice that the population is divided into age intervals (column A). The mortality rate (per 1000), shown in column D, is based on the number of individuals dying during the age interval (column B) divided by the number of individuals surviving at the beginning of the interval (Column C), multiplied by 1000.
英語のヒント
生命表は、生物の生活史について重要な情報を与える。個体群を年齢群、さらに多くの場合は性別にも分け、その群の個体があとどのくらい生きると予想されるかを示す。人の平均余命の推定に保険業界が用いる数理表をもとに作られている。生命表には、次の誕生日までに死ぬ確率(死亡率)、特定の年齢区間で生存個体のうち死ぬ割合、各区間での平均余命などが含まれる。表45.1は、北米北西部原産のドールシープを調べた生命表の例である。個体群が年齢区間に分けられていることに注目しよう(A列)。D列の死亡率(1,000個体当たり)は、区間内の死亡個体数(B列)を、区間開始時の生存個体数(C列)で割り、1,000を掛けて求める。
For example, between ages three and four, 12 individuals die out of the 776 that were remaining from the original 1000 sheep. This number is then multiplied by 1000 to get the mortality rate per thousand.
例えば3〜4歳の区間では、最初の1,000頭から生き残った776頭のうち、12頭が死ぬ。この割合に1,000を掛けると、1,000頭当たりの死亡率が得られる。
As can be seen from the mortality rate data (column D), a high death rate occurred when the sheep were between 6 and 12 months old, and then increased even more from 8 to 12 years old, after which there were few survivors. The data indicate that if a sheep in this population were to survive to age one, it could be expected to live another 7.7 years on average, as shown by the life expectancy numbers in column E.
英語のヒント
死亡率のデータ(D列)を見ると、生後6〜12か月で死亡率が高く、8〜12歳にはさらに高くなり、その後は生存個体がほとんどいない。この個体群のヒツジが1歳まで生き延びれば、E列の平均余命が示すように、その後平均7.7年生きると期待できる。
Life Table of Dall Mountain Sheep Data Adapted from Edward S. Deevey, Jr., “Life Tables for Natural Populations of Animals,” The Quarterly Review of Biology 22, no. 4 (December 1947): 283-314. ドールシープの生命表。Edward S. Deevey, Jr., “Life Tables for Natural Populations of Animals,” The Quarterly Review of Biology 22, no. 4(1947年12月):283–314のデータを改変。 |
||||
|---|---|---|---|---|
Age interval (years) 年齢区間(歳) |
Number dying in age interval out of 1000 born 出生1,000頭のうち、この年齢区間で死ぬ頭数 |
Number surviving at beginning of age interval out of 1000 born 出生1,000頭のうち、この年齢区間の開始時に生存する頭数 |
Mortality rate per 1000 alive at beginning of age interval 区間開始時の生存1,000頭当たりの死亡率 |
Life expectancy or mean lifetime remaining to those attaining age interval この年齢区間に達した個体の平均余命、すなわち残された平均生存年数 |
0-0.5 |
54 |
1000 |
54.0 |
7.06 |
0.5-1 |
145 |
946 |
153.3 |
-- |
1-2 |
12 |
801 |
15.0 |
7.7 |
2-3 |
13 |
789 |
16.5 |
6.8 |
3-4 |
12 |
776 |
15.5 |
5.9 |
4-5 |
30 |
764 |
39.3 |
5.0 |
5-6 |
46 |
734 |
62.7 |
4.2 |
6-7 |
48 |
688 |
69.8 |
3.4 |
7-8 |
69 |
640 |
107.8 |
2.6 |
8-9 |
132 |
571 |
231.2 |
1.9 |
9-10 |
187 |
439 |
426.0 |
1.3 |
10-11 |
156 |
252 |
619.0 |
0.9 |
11-12 |
90 |
96 |
937.5 |
0.6 |
12-13 |
3 |
6 |
500.0 |
1.2 |
13-14 |
3 |
3 |
1000 |
0.7 |