第45章個体群と群集の生態学
45.1 Population Demography45.1 個体群の統計的特性
Learning Objectives学習目標
By the end of this section, you will be able to do the following:
この節を学ぶと、次のことができるようになる。
- Describe how ecologists measure population size and density生態学者が個体群サイズと密度を測る方法を説明する。
- Describe three different patterns of population distribution個体群の3つの分布様式を説明する。
- Use life tables to calculate mortality rates生命表を使って死亡率を計算する。
- Describe the three types of survivorship curves and relate them to specific populations3種類の生存曲線を説明し、具体的な個体群と結び付ける。
Populations are dynamic entities. A population consists of all of the individuals of a particular species that occur in a particular area and have the potential to interact with one another. Populations fluctuate based on a number of factors: seasonal and yearly changes in the environment, natural disasters such as forest fires and volcanic eruptions, and competition for resources between and within species. The statistical study of population dynamics, demography, uses a series of mathematical tools to investigate how populations respond to changes in their biotic and abiotic environments. Many of these tools were originally designed to study human populations. For example, life tables, which detail the life expectancy of individuals within a population, were initially developed by life insurance companies to set insurance rates. In fact, while the term “demographics” is commonly used when discussing humans, all living populations can be studied using this approach.
英語のヒント
個体群は、変動する存在である。ある地域に生息し、互いに関わる可能性のある、特定の種の全個体からなる。個体群は、季節や年による環境の変化、森林火災や火山噴火などの自然災害、種内および種間での資源をめぐる競争など、多くの要因で変動する。個体群動態の統計的研究である個体群統計学は、一連の数学的手法を使って、個体群が生物的・非生物的環境の変化にどう応じるかを調べる。これらの手法の多くは、もともと人間の人口を研究するために作られた。例えば、個体群内の個体の平均余命を詳しく示す生命表は、生命保険会社が保険料率を決めるために開発した。実際、「人口統計」という語は人間について論じる際によく使われるが、この方法はあらゆる生物の個体群に適用できる。
Population Size and Density個体群サイズと密度
The study of any population usually begins by determining how many individuals of a particular species exist, and how closely associated they are with each other. Within a particular habitat, a population can be characterized by its population size (N), the total number of individuals, and its population density, the number of individuals within a specific area or volume. Population size and density are the two main characteristics used to describe and understand populations. For example, populations with more individuals may be more stable than smaller populations based on their genetic variability, and thus their potential to adapt to the environment. Alternatively, a member of a population with low population density (more spread out in the habitat), might have more difficulty finding a mate to reproduce compared to a population of higher density. As is shown in Figure 45.2, smaller organisms tend to be more densely distributed than larger organisms.
英語のヒント
個体群の研究は通常、特定の種が何個体いるか、それらがどれほど近接しているかを調べることから始まる。ある生息地の個体群は、全個体数である個体群サイズ(N)と、一定の面積または体積に含まれる個体数である個体群密度で特徴付けられる。この2つは、個体群を記述・理解するための主要な特徴である。例えば、個体数が多い個体群は、遺伝的変異が多く、そのため環境へ適応できる可能性も高いことから、小さな個体群より安定している場合がある。一方、個体群密度が低い、つまり生息地内で個体がより散らばっている場合には、密度が高い場合に比べて、繁殖相手を見つけにくいことがある。図45.2のように、小さな生物ほど、大きな生物より高密度に分布する傾向がある。
Population Research Methods個体群の調査方法
The most accurate way to determine population size is to simply count all of the individuals within the habitat. However, this method is often not logistically or economically feasible, especially when studying large habitats. Thus, scientists usually study populations by sampling a representative portion of each habitat and using this data to make inferences about the habitat as a whole. A variety of methods can be used to sample populations to determine their size and density. For immobile organisms such as plants, or for very small and slow-moving organisms, a quadrat may be used (Figure 45.3). A quadrat is a way of marking off square areas within a habitat, either by staking out an area with sticks and string, or by the use of a wood, plastic, or metal square placed on the ground. After setting the quadrats, researchers then count the number of individuals that lie within their boundaries. Multiple quadrat samples are performed throughout the habitat at several random locations to estimate the population size and density within the entire habitat. The number and size of quadrat samples depends on the type of organisms under study and other factors, including the density of the organism. For example, if sampling daffodils, a 1 m2 quadrat might be used. With giant redwoods, on the other hand, a larger quadrat of 100 m2 might be employed. This ensures that enough individuals of the species are counted to get an accurate sample that correlates with the habitat, including areas not sampled.
英語のヒント
個体群サイズを最も正確に求めるには、生息地の全個体を数えればよい。しかし、特に広い生息地では、作業上または経済的に実行できないことが多い。そのため科学者は通常、生息地の代表的な一部を標本として調べ、そのデータから生息地全体を推定する。個体群のサイズと密度を求める標本調査には、さまざまな方法がある。植物など移動しない生物や、非常に小さく動きの遅い生物には、方形区を使うことがある(図45.3)。方形区は、生息地の一部を正方形に区切る方法で、棒とひもで囲うか、木、プラスチック、金属製の四角い枠を地面へ置く。研究者は、その内側にある個体を数える。生息地の複数の場所を無作為に選んで調査し、全体の個体群サイズと密度を推定する。方形区の数と大きさは、調べる生物の種類や密度などの要因による。例えばスイセンなら1 m2の方形区を使えるが、巨大なセコイアなら100 m2の大きな方形区を使うことがある。これにより十分な個体数を数え、未調査の区域を含む生息地全体に対応する、正確な標本を得られる。
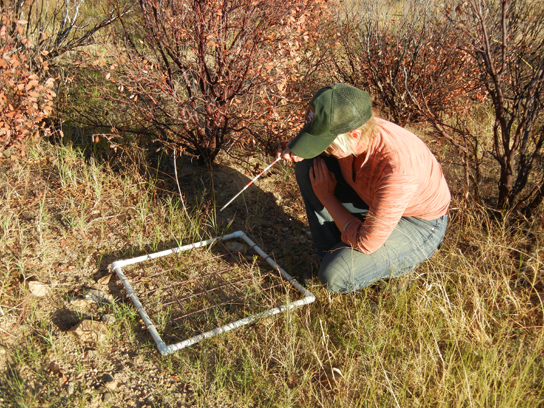

Figure 45.3図 45.3
A scientist uses a quadrat to measure population size and density. (credit: NPS Sonoran Desert Network)
方形区を使って個体群サイズと密度を測る科学者。(出典:NPS Sonoran Desert Network)
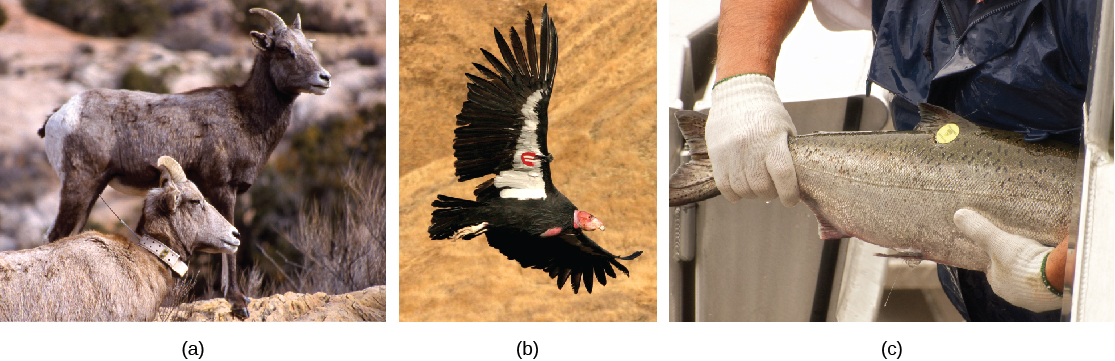
For mobile organisms, such as mammals, birds, or fish, scientists use a technique called mark and recapture. This method involves marking a sample of captured animals in some way (such as tags, bands, paint, or other body markings), and then releasing them back into the environment to allow them to mix with the rest of the population. Later, researchers collect a new sample, including some individuals that are marked (recaptures) and some individuals that are unmarked (Figure 45.4).
英語のヒント
哺乳類、鳥、魚などの移動する生物には、標識再捕法が使われる。捕獲した動物の標本に、札、足輪、塗料、その他の体の印で標識を付け、環境へ戻して、ほかの個体と混ざるようにする。その後、研究者は新たな標本を採取する。その中には標識のある個体(再捕獲個体)と、標識のない個体が含まれる(図45.4)。
OpenStax, Rice University; Biology 2e. (credit a: modification of work by Neal Herbert, NPS; credit b: modification of work by Pacific Southwest Region USFWS; credit c: modification of work by Ingrid Taylar) · CC BY 4.0 · Source出典

Figure 45.4図 45.4
Mark and recapture is used to measure the population size of mobile animals such as (a) bighorn sheep, (b) the California condor, and (c) salmon. (credit a: modification of work by Neal Herbert, NPS; credit b: modification of work by Pacific Southwest Region USFWS; credit c: modification of work by Ingrid Taylar)
標識再捕法は、(a)ビッグホーン、(b)カリフォルニアコンドル、(c)サケなど、移動する動物の個体群サイズの測定に用いられる。(出典:a:Neal Herbert, NPS、b:Pacific Southwest Region USFWS、c:Ingrid Taylarの各作品を改変)
Using the ratio of marked and unmarked individuals, scientists determine how many individuals are in the sample. From this, calculations are used to estimate the total population size. This method assumes that the larger the population, the lower the percentage of tagged organisms that will be recaptured since they will have mixed with more untagged individuals. For example, if 80 deer are captured, tagged, and released into the forest, and later 100 deer are captured and 20 of them are already marked, we can estimate the population size (N) using the following equation:
英語のヒント
科学者は標識個体と無標識個体の比率を用いて、標本内の個体数を求める。そこから計算によって、個体群全体のサイズを推定する。この方法は、個体群が大きいほど、より多くの無標識個体と混ざるため、再捕獲される標識個体の割合が低くなると仮定している。例えば、シカ80頭を捕獲して標識を付け、森へ戻したとする。後に100頭を捕獲し、そのうち20頭に標識があれば、次の式で個体群サイズ(N)を推定できる。
Using our example, the population size would be estimated at 400.
この例では、個体群サイズは400と推定される。
Therefore, there are an estimated 400 total individuals in the original population.
したがって、元の個体群の全個体数は400と推定される。
There are some limitations to the mark and recapture method. Some animals from the first catch may learn to avoid capture in the second round, thus inflating population estimates. Alternatively, some animals may prefer to be retrapped (especially if a food reward is offered), resulting in an underestimate of population size. Also, some species may be harmed by the marking technique, reducing their survival. A variety of other techniques have been developed, including the electronic tracking of animals tagged with radio transmitters and the use of data from commercial fishing and trapping operations to estimate the size and health of populations and communities.
英語のヒント
標識再捕法には限界もある。最初に捕獲された動物の一部は、2回目には捕獲を避けることを学ぶかもしれない。そうなると、個体群サイズを過大に推定する。逆に、特に餌がもらえる場合、一部の動物は再び捕まることを好み、個体群サイズを過小に推定することになる。また、標識を付ける方法で傷つき、生存率が低下する種もある。ほかにも、無線送信機を付けた動物の電子的な追跡や、商業漁業・わな猟のデータから、個体群や群集の規模と健全性を推定する方法などが開発されている。