第44章生態学と生物圏
44.5 Climate and the Effects of Global Climate Change44.5 気候と地球規模の気候変動の影響
Learning Objectives学習目標
By the end of this section, you will be able to do the following:
この節を学ぶと、次のことができるようになる。
- Define global climate change地球規模の気候変動を定義する。
- Summarize the effects of the Industrial Revolution on global atmospheric carbon dioxide concentration産業革命が世界の大気中の二酸化炭素濃度に及ぼした影響をまとめる。
- Describe three natural factors affecting long-term global climate長期的な地球の気候に影響する、3つの自然要因を説明する。
- List two or more greenhouse gases and describe their role in the greenhouse effect温室効果ガスを2つ以上挙げ、温室効果における役割を説明する。
All biomes are universally affected by global conditions, such as climate, that ultimately shape each biome’s environment. Scientists who study climate have noted a series of marked changes that have gradually become increasingly evident during the last sixty years. Global climate change is the term used to describe altered global weather patterns, especially a worldwide increase in temperature and resulting changes in the climate, due largely to rising levels of atmospheric carbon dioxide.
英語のヒント
すべてのバイオームは、気候などの地球規模の条件の影響を受け、それらが最終的に各バイオームの環境を形作る。気候を研究する科学者は、過去60年間に徐々に明瞭になってきた、一連の顕著な変化を指摘している。地球規模の気候変動とは、世界の気象パターンの変化、特に、主に大気中の二酸化炭素の増加による世界的な気温上昇と、それに伴う気候の変化を表す語である。
Climate and Weather気候と天気
A common misconception about global climate change is that a specific weather event occurring in a particular region (for example, a very cool week in June in central Indiana) provides evidence of global climate change. However, a cold week in June is a weather-related event and not a climate-related one. These misconceptions often arise because of confusion over the terms climate and weather.
英語のヒント
地球規模の気候変動についてのよくある誤解に、特定の地域で起こる個別の気象現象、例えばインディアナ州中央部の6月の非常に涼しい1週間が、気候変動の証拠になるというものがある。しかし、6月の寒い1週間は、気候ではなく天気に関わる出来事である。このような誤解は、気候と天気という語の混同から生じることが多い。
Climate refers to the long-term, predictable atmospheric conditions of a specific area. The climate of a biome is characterized by having consistent seasonal temperature and rainfall ranges. Climate does not address the amount of rain that fell on one particular day in a biome or the colder-than-average temperatures that occurred on one day. In contrast, weather refers to the conditions of the atmosphere during a short period of time. Weather forecasts are usually made for 48-hour cycles. Long-range weather forecasts are available but can be unreliable.
英語のヒント
気候とは、ある地域の長期的で予測可能な大気の状態である。バイオームの気候は、季節ごとの気温と降水量が一定の範囲をとることで特徴付けられる。特定の1日に降った雨の量や、その日の気温が平均より低かったことを扱うものではない。これに対して、天気は短期間の大気の状態を指す。天気予報は通常、48時間の単位で行われる。長期の天気予報もあるが、信頼性に欠ける場合がある。
To better understand the difference between climate and weather, imagine that you are planning an outdoor event in northern Wisconsin. You would be thinking about climate when you plan the event in the summer rather than the winter because you have long-term knowledge that any given Saturday in the months of May to August would be a better choice for an outdoor event in Wisconsin than any given Saturday in January. However, you cannot determine the specific day that the event should be held on because it is difficult to accurately predict the weather on a specific day. Climate can be considered “average” weather that takes place over many years.
英語のヒント
気候と天気の違いをよりよく理解するため、ウィスコンシン州北部で屋外の催しを計画していると考えてみよう。冬ではなく夏に開催を計画するとき、考慮しているのは気候である。ウィスコンシンでは、5〜8月のどの土曜日も、1月のどの土曜日より屋外の催しに適しているという、長年の知識があるためだ。しかし、特定の日の天気を正確に予測するのは難しいため、開催に適した具体的な日までは決められない。気候は、何年にもわたる「平均的」な天気と考えられる。
Global Climate Change地球規模の気候変動
Climate change can be understood by approaching three areas of study:
気候変動は、次の3つの研究領域から考えることで理解できる。
- evidence of current and past global climate change現在および過去の地球規模の気候変動を示す証拠
- drivers of global climate change地球規模の気候変動を引き起こす要因
- documented results of climate change記録されている気候変動の結果
It is helpful to keep these three different aspects of climate change clearly separated when consuming media reports about global climate change. We should note that it is common for reports and discussions about global climate change to confuse the data showing that Earth’s climate is changing with the factors that drive this climate change.
英語のヒント
地球規模の気候変動についての報道に接するときは、この3つの異なる側面を明確に分けておくと役立つ。報道や議論では、地球の気候が変化していることを示すデータと、その変化を引き起こす要因とを混同することが多い点に注意しよう。
Evidence for Global Climate Change地球規模の気候変動の証拠
Since scientists cannot go back in time to directly measure climatic variables, such as average temperature and precipitation, they must instead indirectly measure temperature. To do this, scientists rely on historical evidence of Earth’s past climate.
英語のヒント
科学者は過去に戻って平均気温や降水量などの気候変数を直接測れないため、代わりに間接的に気温を測定しなければならない。そのために、地球の過去の気候についての歴史的な証拠を利用する。
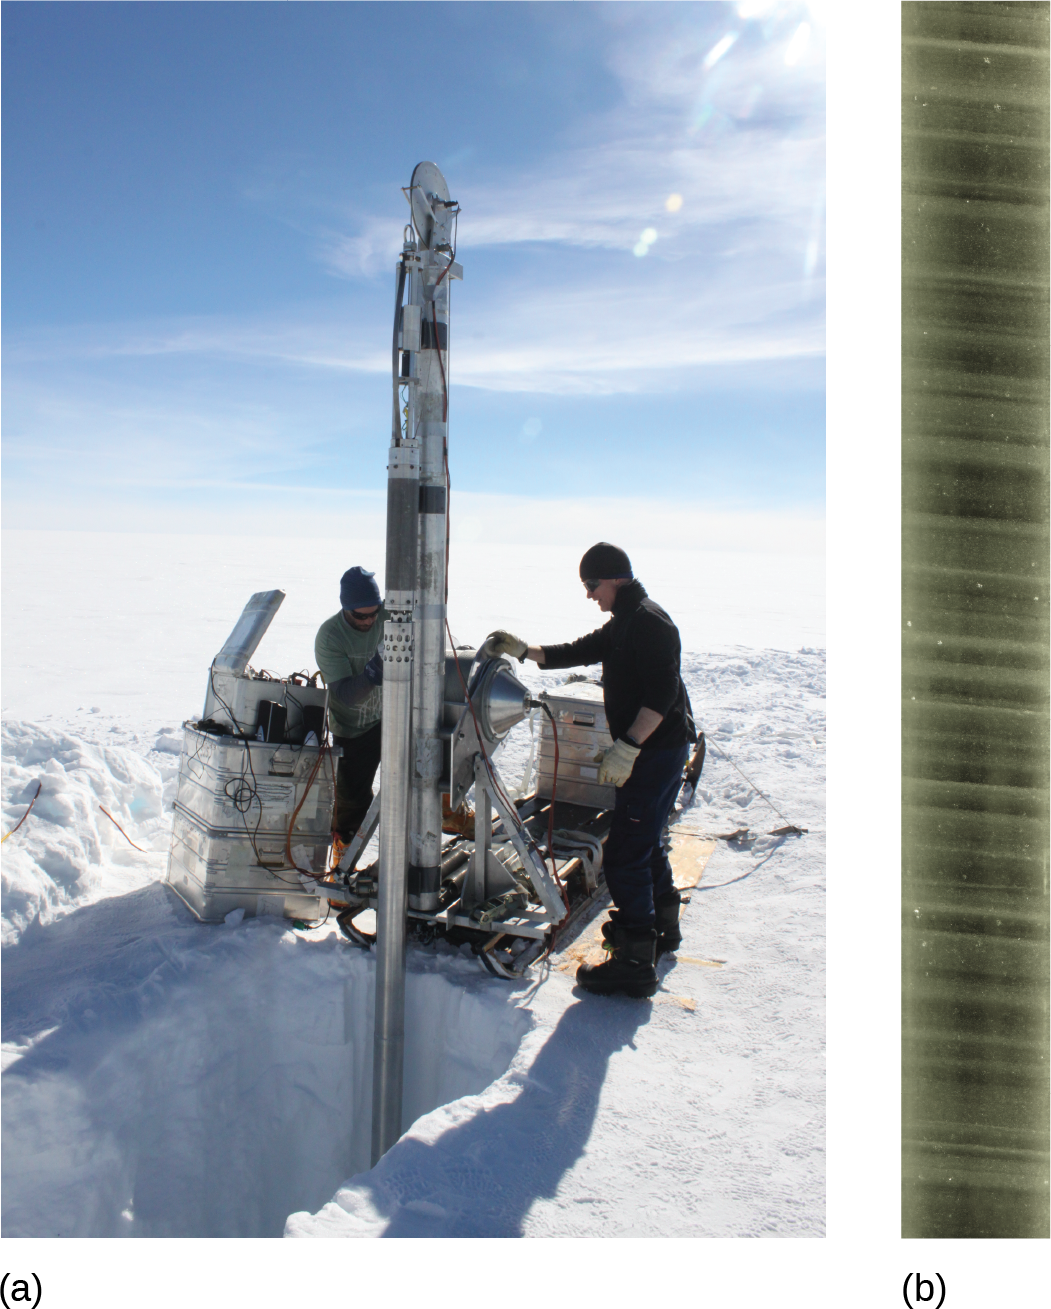
Antarctic ice cores are a key example of such evidence for climate change. These ice cores are samples of polar ice obtained by means of drills that reach thousands of meters into ice sheets or high mountain glaciers. Viewing the ice cores is like traveling backwards through time; the deeper the sample, the earlier the time period. Trapped within the ice are air bubbles and other biological evidence that can reveal temperature and carbon dioxide data. Antarctic ice cores have been collected and analyzed to indirectly estimate the temperature of the Earth over the past 400,000 years (Figure 44.26a). The data represented in Figure 44.27 is an example of such analyses. The 0 °C on this graph refers to the long-term average. Temperatures that are greater than 0 °C exceed Earth’s long-term average temperature. Conversely, temperatures that are less than 0 °C are less than Earth’s average temperature. This figure shows that there have been periodic cycles of increasing and decreasing temperature.
英語のヒント
南極の氷床コアは、気候変動の証拠の重要な例である。これは、氷床や高山の氷河へ数千m掘り進むドリルで取り出した、極地の氷の試料である。氷床コアを見ることは、時間をさかのぼる旅に似ている。試料が深い場所のものほど、古い時代のものになる。氷の中には、気温や二酸化炭素のデータを明らかにできる気泡や、その他の生物学的証拠が閉じ込められている。南極の氷床コアを採取・分析することで、過去40万年間の地球の気温が間接的に推定されている(図44.26a)。図44.27のデータは、そのような分析の一例である。グラフの0 ℃は長期平均を示す。0 ℃を上回る値は地球の長期平均気温より高く、逆に0 ℃未満の値は平均より低い。この図は、気温が上昇と下降を周期的に繰り返してきたことを示している。
OpenStax, Rice University; Biology 2e. (credit: a: Helle Astrid Kjær; b: National Ice Core Laboratory, USGS) · CC BY 4.0 · Source出典
Figure 44.26図 44.26
Scientists drill for ice cores in polar regions. The ice contains air bubbles and biological substances that provide important information for researchers. (credit: a: Helle Astrid Kjær; b: National Ice Core Laboratory, USGS)
科学者は極地で掘削し、氷床コアを採取する。氷には気泡や生物由来の物質が含まれ、研究者に重要な情報を与える。(出典:a:Helle Astrid Kjær、b:National Ice Core Laboratory, USGS)
Before the late 1800s, the Earth has been as much as 9 °C cooler and about 3 °C warmer. Note that the graph in Figure 44.27b shows that the atmospheric concentration of carbon dioxide has also risen and fallen in periodic cycles. Also note the relationship between carbon dioxide concentration and temperature. Figure 44.27b shows that carbon dioxide levels in the atmosphere have historically cycled between 180 and 300 parts per million (ppm) by volume.
英語のヒント
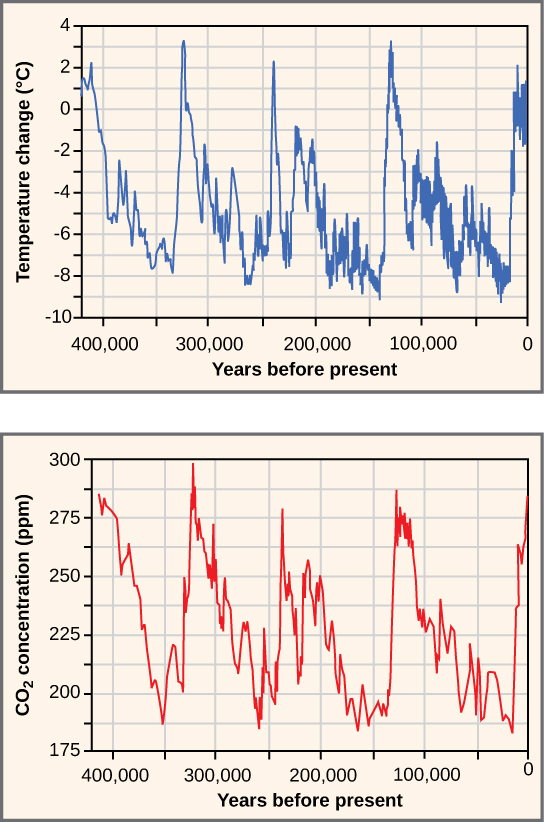
Figure 44.27図 44.27
Ice at the Russian Vostok station in East Antarctica was laid down over the course of 420,000 years and reached a depth of over 3,000 m. By measuring the amount of CO2 trapped in the ice, scientists have determined past atmospheric CO2 concentrations. Temperatures relative to modern day were determined from the amount of deuterium (a nonradioactive isotope of hydrogen) present.
東南極のロシアのボストーク基地の氷は、42万年かけて積み重なり、深さ3,000 m以上に達した。科学者は氷に閉じ込められたCO2 の量から、過去の大気中のCO2濃度を求めた。現在を基準とする気温は、含まれる重水素(水素の非放射性同位体)の量から求めた。
Figure 44.27a does not show the last 2,000 years with enough detail to compare the changes of Earth’s temperature during the last 400,000 years with the temperature change that has occurred in the more recent past. Two significant temperature anomalies, or irregularities, have occurred in the last 2,000 years. These are the Medieval Climate Anomaly (or the Medieval Warm Period) and the Little Ice Age. A third temperature anomaly aligns with the Industrial Era. The Medieval Climate Anomaly occurred between 900 and 1300 AD. During this time period, many climate scientists think that slightly warmer weather conditions prevailed in many parts of the world; the higher-than-average temperature changes varied between 0.10 °C and 0.20 °C above the norm. Although 0.10 °C does not seem large enough to produce any noticeable change, it did free seas of ice. Because of this warming, the Vikings were able to colonize Greenland.
英語のヒント
図44.27aでは、最近2,000年間が十分詳しく示されていないため、過去40万年間の気温変化を、より最近の変化と比較できない。最近2,000年間には、顕著な気温の異常が2度あった。中世気候異常(中世温暖期)と小氷期である。3つ目の異常は、工業化時代と一致する。中世気候異常は西暦900〜1300年に起こった。多くの気候科学者は、この時期には世界の多くの地域で、やや暖かい気象条件が広がっていたと考えている。平均を上回る気温の変化は、平常値より0.10〜0.20 ℃高い範囲だった。0.10 ℃は目立つ変化を生むほど大きくないように思えるが、実際には海の氷を解かした。この温暖化により、バイキングはグリーンランドに入植できた。
The Little Ice Age was a cold period that occurred between 1550 AD and 1850 AD. During this time, a slight cooling of a little less than 1 °C was observed in North America, Europe, and possibly other areas of the Earth. This 1 °C change in global temperature is a seemingly small deviation in temperature (as was observed during the Medieval Climate Anomaly); however, it also resulted in noticeable climatic changes. Historical accounts reveal a time of exceptionally harsh winters with much snow and frost.
英語のヒント
小氷期は、西暦1550〜1850年の寒冷な時期だった。北米、ヨーロッパ、そしておそらく地球上のほかの地域でも、1 ℃を少し下回る、わずかな寒冷化が観測された。中世気候異常と同様に、世界の気温の1 ℃の変化は、一見小さなずれである。それでも、目立った気候の変化をもたらした。歴史的な記録は、多量の雪や霜を伴う、例外的に厳しい冬の時代を伝えている。
The Industrial Revolution, which began around 1750, was characterized by changes in much of human society. Advances in agriculture increased the food supply, which improved the standard of living for people in Europe and the United States. New technologies were invented that provided jobs and cheaper goods. These new technologies were powered using fossil fuels, especially coal. The Industrial Revolution starting in the early nineteenth century ushered in the beginning of the Industrial Era. When a fossil fuel is burned, carbon dioxide is released. With the beginning of the Industrial Era, atmospheric carbon dioxide began to rise (Figure 44.28).
英語のヒント
1750年ごろに始まった産業革命は、人間社会の多くの部分に変化をもたらした。農業の進歩で食料供給が増え、ヨーロッパと米国の人々の生活水準が向上した。雇用と安価な製品を生む新技術が発明された。これらは、特に石炭などの化石燃料を動力源としていた。19世紀初頭に始まる産業革命は、工業化時代の幕開けとなった。化石燃料を燃やすと二酸化炭素が放出される。工業化時代の開始とともに、大気中の二酸化炭素は増え始めた(図44.28)。
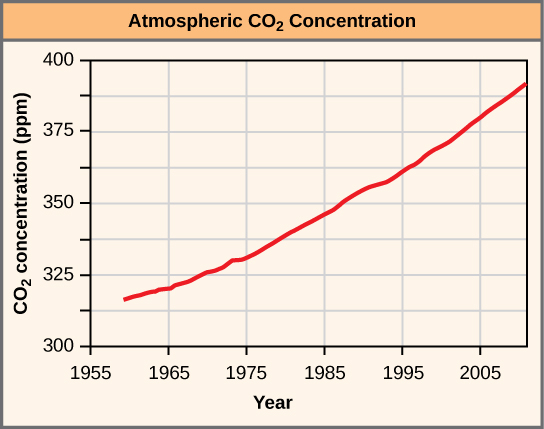


Figure 44.28図 44.28
The atmospheric concentration of CO2 has risen steadily since the beginning of industrialization.
工業化の開始以来、大気中のCO2濃度は着実に上昇している。