第17章バイオテクノロジーとゲノミクス
17.2 Mapping Genomes17.2 ゲノムの地図を作る
Learning Objectives学習目標
By the end of this section, you will be able to do the following:
この節を終えると、次のことができるようになる。
- Define genomicsゲノミクスを定義する。
- Describe genetic and physical maps遺伝地図と物理地図を説明する。
- Describe genomic mapping methodsゲノムマッピングの方法を説明する。
Genomics is the study of entire genomes, including the complete set of genes, their nucleotide sequence and organization, and their interactions within a species and with other species. Genome mapping is the process of finding the locations of genes on each chromosome. The maps that genome mapping create are comparable to the maps that we use to navigate streets. A genetic map is an illustration that lists genes and their location on a chromosome. Genetic maps provide the big picture (similar to an interstate highway map) and use genetic markers (similar to landmarks). A genetic marker is a gene or sequence on a chromosome that co-segregates (shows genetic linkage) with a specific trait. Early geneticists called this linkage analysis. Physical maps present the intimate details of smaller chromosome regions (similar to a detailed road map). A physical map is a representation of the physical distance, in nucleotides, between genes or genetic markers. Both genetic linkage maps and physical maps are required to build a genome’s complete picture. Having a complete genome map of the genome makes it easier for researchers to study individual genes. Human genome maps help researchers in their efforts to identify human disease-causing genes related to illnesses like cancer, heart disease, and cystic fibrosis. We can use genome mapping in a variety of other applications, such as using live microbes to clean up pollutants or even prevent pollution. Research involving plant genome mapping may lead to producing higher crop yields or developing plants that better adapt to climate change.
英語のヒント
ゲノミクスはゲノム全体の研究であり、遺伝子の完全な一式、そのヌクレオチド配列と配置、同じ種の中や他種との間での相互作用を含む。ゲノムマッピングは、各染色体上の遺伝子の位置を見つける過程である。こうしてできる地図は、私たちが道をたどるために使う地図に似ている。遺伝地図は、遺伝子と、その染色体上の位置を示す図である。遺伝地図は、州間高速道路の地図のように全体像を示し、目印に相当する遺伝マーカーを用いる。遺伝マーカーとは、特定の形質とともに分離する(遺伝的連鎖を示す)、染色体上の遺伝子や配列である。初期の遺伝学者は、これを連鎖解析と呼んだ。物理地図は、詳しい道路地図のように、染色体の小さな領域の細部を示す。物理地図は、遺伝子や遺伝マーカーの間の物理的な距離を、ヌクレオチド数で表したものである。ゲノムの全体像を作るには、遺伝的連鎖地図と物理地図の両方が必要である。完全なゲノム地図があれば、個々の遺伝子を研究しやすくなる。ヒトのゲノム地図は、がん、心臓病、嚢胞性線維症などの病気を引き起こす遺伝子を特定する研究に役立つ。ゲノムマッピングには、生きた微生物による汚染物質の除去や、さらには汚染の予防など、さまざまな応用がある。植物のゲノムマッピングの研究は、作物の収量の増加や、気候変動によく適応する植物の開発につながる可能性がある。
Genetic Maps遺伝地図
The study of genetic maps begins with linkage analysis, a procedure that analyzes the recombination frequency between genes to determine if they are linked or show independent assortment. Scientists used the term linkage before the discovery of DNA. Early geneticists relied on observing phenotypic changes to understand an organism’s genotype. Shortly after Gregor Mendel (the father of modern genetics) proposed that traits were determined by what we now call genes, other researchers observed that different traits were often inherited together, and thereby deduced that the genes were physically linked by their location on the same chromosome. Gene mapping relative to each other based on linkage analysis led to developing the first genetic maps.
英語のヒント
遺伝地図の研究は、連鎖解析から始まる。これは遺伝子間の組換え頻度を分析し、それらが連鎖しているのか、独立に分配されるのかを調べる手法である。「連鎖」という語は、DNAの発見以前から使われていた。初期の遺伝学者は、生物の遺伝子型を理解するために、表現型の変化の観察を頼りにしていた。近代遺伝学の父グレゴール・メンデルが、現在私たちが遺伝子と呼ぶものによって形質が決まると提唱してまもなく、ほかの研究者は、異なる形質がしばしば一緒に遺伝することを観察した。そこから、遺伝子は同じ染色体上に位置することで、物理的につながっていると推論した。連鎖解析に基づいて遺伝子の相対的な位置を地図にすることから、最初の遺伝地図が作られた。
Observations that certain traits were always linked and certain others were not linked came from studying the offspring of crosses between parents with different traits. For example, in garden pea experiments, researchers discovered, that the flower’s color and plant pollen’s shape were linked traits, and therefore the genes encoding these traits were in close proximity on the same chromosome. We call exchanging DNA between homologous chromosome pairs genetic recombination, which occurs by crossing over DNA between homologous DNA strands, such as nonsister chromatids. Linkage analysis involves studying the recombination frequency between any two genes. The greater the distance between two genes, the higher the chance that a recombination event will occur between them, and the higher the recombination frequency between them. Figure 17.11 shows two possibilities for recombination between two nonsister chromatids during meiosis. If the recombination frequency between two genes is less than 50 percent, they are linked.
英語のヒント
ある形質どうしは常に連鎖し、別の形質どうしは連鎖しないという観察は、異なる形質をもつ親どうしの交配で生じた子を研究することで得られた。例えばエンドウの実験では、花の色と花粉の形が連鎖する形質であり、それらをコードする遺伝子は同じ染色体上の近い位置にあると分かった。相同染色体の対の間でDNAを交換することを、遺伝的組換えと呼ぶ。これは、非姉妹染色分体などの相同なDNA鎖の間で、DNAの交叉が起こることによって生じる。連鎖解析では、任意の二つの遺伝子間の組換え頻度を調べる。二つの遺伝子の距離が大きいほど、その間で組換えが起こる可能性が高くなり、組換え頻度も高くなる。図17.11は、減数分裂中の二つの非姉妹染色分体の間で起こる組換えの、二つの可能性を示す。二つの遺伝子間の組換え頻度が50パーセント未満であれば、それらは連鎖している。
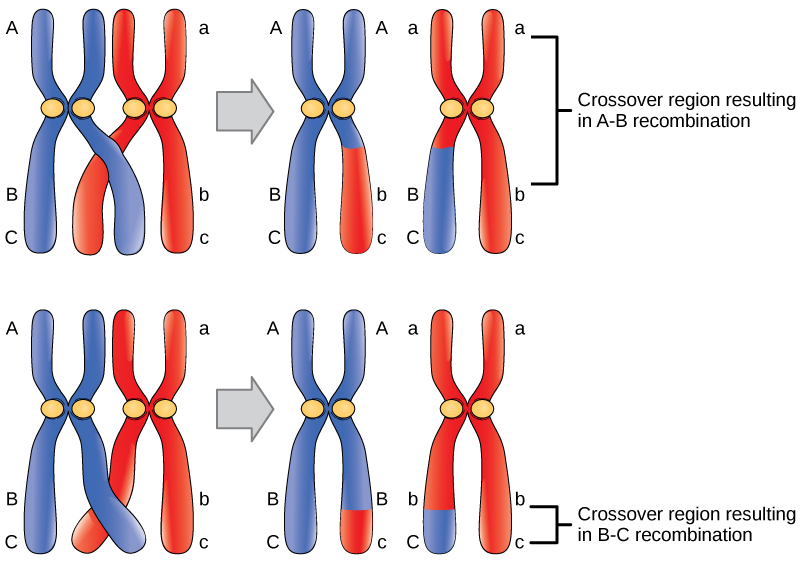

Figure 17.11図 17.11
Crossover may occur at different locations on the chromosome. Recombination between genes A and B is more frequent than recombination between genes B and C because genes A and B are farther apart. Therefore, a crossover is more likely to occur between them.
交叉は染色体のさまざまな位置で起こりうる。AとBの遺伝子間の組換えは、BとCの間の組換えより頻繁に起こる。AとBの方が遠く離れているため、その間で交叉が起こる可能性が高いからである。
The generation of genetic maps requires markers, just as a road map requires landmarks (such as rivers and mountains). Scientists based early genetic maps on using known genes as markers. Scientists now use more sophisticated markers, including those based on non-coding DNA, to compare individuals’ genomes in a population. Although individuals of a given species are genetically similar, they are not identical. Every individual has a unique set of traits. These minor differences in the genome between individuals in a population are useful for genetic mapping purposes. In general, a good genetic marker is a region on the chromosome that shows variability or polymorphism (multiple forms) in the population.
英語のヒント
道路地図に川や山などの目印が必要なように、遺伝地図の作製にもマーカーが必要である。初期の遺伝地図では、既知の遺伝子がマーカーとして使われた。現在では、集団内の個体のゲノムを比較するために、非コードDNAに基づくものを含め、より高度なマーカーを使う。同じ種の個体は遺伝的に似ているが、まったく同じではない。各個体は、それぞれ固有の形質の組み合わせをもつ。集団内の個体間にあるゲノムの小さな違いは、遺伝地図の作製に役立つ。一般に、優れた遺伝マーカーは、集団内で変異性や多型(複数の形)を示す染色体領域である。
Some genetic markers that scientists use in generating genetic maps are restriction fragment length polymorphisms (RFLP), variable number of tandem repeats (VNTRs), microsatellite polymorphisms, and the single nucleotide polymorphisms (SNPs). We can detect RFLPs (sometimes pronounced “rif-lips”) when the DNA of an individual is cut with a restriction endonuclease that recognizes specific sequences in the DNA to generate a series of DNA fragments, which we can then analyze using gel electrophoresis. Every individual’s DNA will give rise to a unique pattern of bands when cut with a particular set of restriction endonucleases. Scientists sometimes refer to this as an individual’s DNA “fingerprint.” Certain chromosome regions that are subject to polymorphism will lead to generating the unique banding pattern. VNTRs are repeated sets of nucleotides present in DNA’s non-coding regions. Non-coding, or “junk,” DNA has no known biological function; however, research shows that much of this DNA is actually transcribed. While its function is uncertain, it is certainly active, and it may be involved in regulating coding genes. The number of repeats may vary in a population’s individual organisms. Microsatellite polymorphisms are similar to VNTRs, but the repeat unit is very small. SNPs are variations in a single nucleotide.
英語のヒント
遺伝地図の作製に用いられる遺伝マーカーには、制限酵素断片長多型(RFLP)、縦列反復数の変異(VNTR)、マイクロサテライト多型、一塩基多型(SNP)がある。RFLP(「リフリップス」と発音されることもある)は、個体のDNAを、特定の配列を認識する制限エンドヌクレアーゼで切断し、一連のDNA断片を作り、それをゲル電気泳動で分析することで検出できる。各個体のDNAは、特定の制限エンドヌクレアーゼの組み合わせで切ると、固有の帯のパターンを生じる。これを、その個体のDNA「指紋」と呼ぶことがある。多型を示す特定の染色体領域が、固有の帯のパターンを生み出す。VNTRは、DNAの非コード領域に存在する、ヌクレオチドの組の繰り返しである。非コードDNA、すなわち「ジャンク」DNAには、知られている生物学的機能がない。しかし、研究によると、その多くは実際に転写される。機能は不明でも、確かに活動しており、コード遺伝子の調節に関与する可能性がある。反復の回数は、集団の個体ごとに異なる場合がある。マイクロサテライト多型はVNTRと似ているが、反復単位が非常に小さい。SNPは、一つのヌクレオチドの違いである。
Because genetic maps rely completely on the natural process of recombination, natural increases or decreases in the recombination level of a given genome area affects mapping. Some parts of the genome are recombination hotspots; whereas, others do not show a propensity for recombination. For this reason, it is important to look at mapping information developed by multiple methods.
英語のヒント
遺伝地図は組換えという自然の過程に完全に依存するため、ゲノムのある領域で組換えの程度が自然に増減することは、地図作製に影響する。ゲノムの一部は組換えのホットスポットである一方、ほかの部分では組換えが起こりやすい傾向は見られない。このため、複数の方法で得た地図情報を見ることが重要である。