第12章メンデルの実験と遺伝
Forked-Line Method分岐図法
When more than two genes are being considered, the Punnett-square method becomes unwieldy. For instance, examining a cross involving four genes would require a 16 × 16 grid containing 256 boxes. It would be extremely cumbersome to manually enter each genotype. For more complex crosses, the forked-line and probability methods are preferred.
英語のヒント
三つ以上の遺伝子を考えると、パネット方形は扱いにくくなる。例えば四遺伝子の交配は、256の升目を持つ16×16の格子を必要とし、各遺伝子型を手書きするのは非常に面倒である。より複雑な交配には分岐図法や確率法が適している。
To prepare a forked-line diagram for a cross between F1 heterozygotes resulting from a cross between AABBCC and aabbcc parents, we first create rows equal to the number of genes being considered, and then segregate the alleles in each row on forked lines according to the probabilities for individual monohybrid crosses (Figure 12.17). We then multiply the values along each forked path to obtain the F2 offspring probabilities. Note that this process is a diagrammatic version of the product rule. The values along each forked pathway can be multiplied because each gene assorts independently. For a trihybrid cross, the F2 phenotypic ratio is 27:9:9:9:3:3:3:1.
英語のヒント
AABBCCとaabbccの親からできたF1ヘテロ接合体どうしの交配を分岐図で表すには、まず考える遺伝子数と同じ数の行を作り、各行で一遺伝子雑種交配の確率に従って対立遺伝子を枝分かれさせる(図12.17)。次に各経路に沿って値を掛け、F2の子の確率を求める。これは積の法則を図にしたものである。各遺伝子が独立に振り分けられるため、経路上の値を掛け合わせられる。三遺伝子雑種交配のF2表現型比は27:9:9:9:3:3:3:1となる。
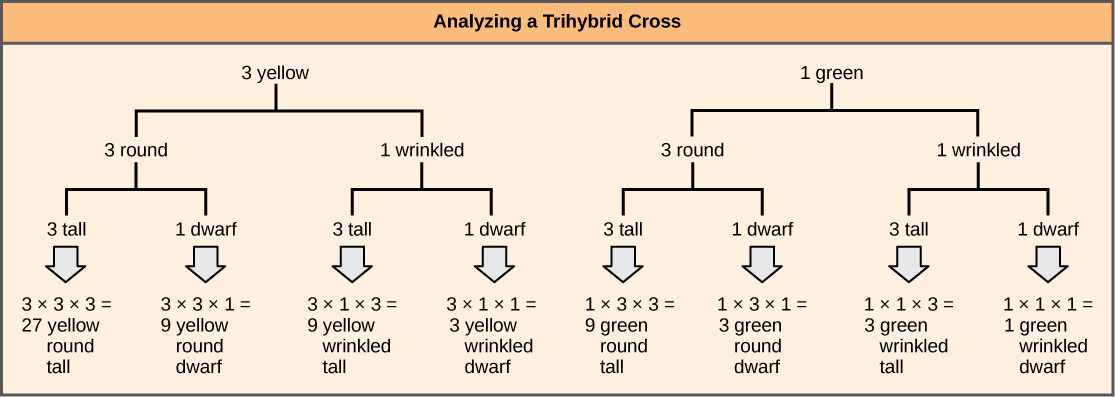

Figure 12.17図 12.17
The forked-line method can be used to analyze a trihybrid cross. Here, the probability for color in the F2 generation occupies the top row (3 yellow:1 green). The probability for shape occupies the second row (3 round: 1 wrinkled), and the probability for height occupies the third row (3 tall:1 dwarf). The probability for each possible combination of traits is calculated by multiplying the probability for each individual trait. Thus, the probability of F2 offspring having yellow, round, and tall traits is 3 × 3 × 3, or 27.
分岐図法で三遺伝子雑種交配を分析できる。最上段はF2の色の確率(黄色3:緑色1)、2段目は形(丸3:しわ1)、3段目は草丈(高性3:矮性1)である。各形質の確率を掛け合わせ、可能な組み合わせの確率を計算する。したがってF2が黄色・丸・高性を持つ確率は3×3×3、つまり27となる。
Probability Method確率法
While the forked-line method is a diagrammatic approach to keeping track of probabilities in a cross, the probability method gives the proportions of offspring expected to exhibit each phenotype (or genotype) without the added visual assistance. Both methods make use of the product rule and consider the alleles for each gene separately. Earlier, we examined the phenotypic proportions for a trihybrid cross using the forked-line method; now we will use the probability method to examine the genotypic proportions for a cross with even more genes.
英語のヒント
分岐図法は交配の確率を図で追う方法だが、確率法は図の助けを使わず、各表現型や遺伝子型の子の予想割合を求める。どちらも積の法則を用い、遺伝子ごとに対立遺伝子を別々に考える。先ほどは分岐図法で三遺伝子雑種交配の表現型の割合を調べた。今度は、さらに多くの遺伝子を含む交配の遺伝子型の割合を、確率法で調べよう。
For a trihybrid cross, writing out the forked-line method is tedious, albeit not as tedious as using the Punnett-square method. To fully demonstrate the power of the probability method, however, we can consider specific genetic calculations. For instance, for a tetrahybrid cross between individuals that are heterozygotes for all four genes, and in which all four genes are sorting independently and in a dominant and recessive pattern, what proportion of the offspring will be expected to be homozygous recessive for all four alleles? Rather than writing out every possible genotype, we can use the probability method. We know that for each gene, the fraction of homozygous recessive offspring will be 1/4. Therefore, multiplying this fraction for each of the four genes, (1/4) × (1/4) × (1/4) × (1/4), we determine that 1/256 of the offspring will be quadruply homozygous recessive.
英語のヒント
三遺伝子雑種交配の分岐図をすべて書くのは、パネット方形ほどではないものの骨が折れる。しかし確率法の力は、特定の遺伝計算で十分に示せる。例えば四つの遺伝子すべてでヘテロ接合の個体どうしを交配し、各遺伝子が独立に振り分けられ、優性・劣性に従うとする。すべてで劣性ホモ接合になる子の割合はいくらか。すべての遺伝子型を書かずとも、確率法を使える。各遺伝子で劣性ホモ接合の子は1/4なので、四遺伝子分を掛け、(1/4)×(1/4)×(1/4)×(1/4)=1/256となる。
For the same tetrahybrid cross, what is the expected proportion of offspring that have the dominant phenotype at all four loci? We can answer this question using phenotypic proportions, but let’s do it the hard way—using genotypic proportions. The question asks for the proportion of offspring that are 1) homozygous dominant at A or heterozygous at A, and 2) homozygous at B or heterozygous at B, and so on. Noting the “or” and “and” in each circumstance makes clear where to apply the sum and product rules. The probability of a homozygous dominant at A is 1/4 and the probability of a heterozygote at A is 1/2. The probability of the homozygote or the heterozygote is 1/4 + 1/2 = 3/4 using the sum rule. The same probability can be obtained in the same way for each of the other genes, so that the probability of a dominant phenotype at A and B and C and D is, using the product rule, equal to 3/4 × 3/4 × 3/4 × 3/4, or 81/256. If you are ever unsure about how to combine probabilities, returning to the forked-line method should make it clear.
同じ四遺伝子雑種交配で、四つの遺伝子座すべてに優性表現型を持つ子の予想割合はいくらか。表現型の割合でも答えられるが、ここでは難しいほうの遺伝子型の割合を使ってみよう。問われているのは、(1)Aで優性ホモ接合またはヘテロ接合、かつ(2)Bでホモ接合またはヘテロ接合、というように続く条件を満たす子の割合である。「または」と「かつ」に注目すれば、和と積の法則をどこで使うか分かる。Aで優性ホモ接合の確率は1/4、ヘテロ接合は1/2なので、そのどちらかの確率は和の法則で1/4+1/2=3/4となる。ほかの遺伝子でも同じなので、AかつBかつCかつDで優性表現型となる確率は、積の法則で3/4×3/4×3/4×3/4=81/256である。確率の組み合わせ方が分からなくなったら、分岐図法に戻ると明らかになる。