第30章政府予算と財政政策
30.3 Federal Deficits and the National Debt30.3 連邦財政赤字と国の債務
Learning Objectives学習目標
Learning Objectives学習目標
By the end of this section, you will be able to:
英語のヒント
この節を学ぶと、次のことができるようになる。
- Explain the U.S. federal budget in terms of annual debt and accumulated debt
英語のヒント
年間の債務と累積債務の観点から、アメリカ連邦予算を説明する - Understand how economic growth or decline can influence a budget surplus or budget deficit
英語のヒント
経済の成長や衰退が、財政黒字や財政赤字にどう影響しうるかを理解する
Having discussed the revenue (taxes) and expense (spending) side of the budget, we now turn to the annual budget deficit or surplus, which is the difference between the tax revenue collected and spending over a fiscal year, which starts October 1 and ends September 30 of the next year.
英語のヒント
予算の歳入、つまり税と、経費、つまり支出を論じたので、次に年間の財政赤字または黒字に目を向ける。これは、10月1日に始まり翌年9月30日に終わる会計年度の間に、徴収した税収と支出の差である。
Figure 30.7 shows the pattern of annual federal budget deficits and surpluses, back to 1930, as a share of GDP. When the line is above the horizontal axis, the budget is in surplus. When the line is below the horizontal axis, a budget deficit occurred. Clearly, the biggest deficits as a share of GDP during this time were incurred to finance World War II. Deficits were also large during the 1930s, the 1980s, the early 1990s, 2007–2009 (the Great Recession), and 2020 (the pandemic-induced recession).
英語のヒント
図30.7は、1930年にさかのぼって、毎年の連邦財政赤字と黒字の推移をGDP比で示す。線が横軸より上にあれば、予算は黒字である。線が横軸より下なら、財政赤字が生じた。この期間でGDP比の赤字が最大だったのは、明らかに第二次世界大戦の資金を賄うためだった。1930年代、1980年代、1990年代初頭、2007~2009年の大不況、2020年のパンデミックによる景気後退でも、赤字は大きかった。
Pattern of Federal Budget Deficits and Surpluses, 1929–2020連邦財政赤字と黒字の推移、1929~2020年
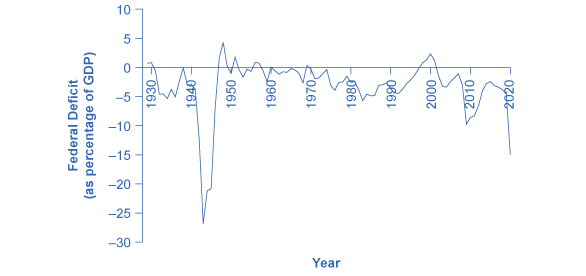
Figure 30.7図 30.7
The federal government has run budget deficits for decades. The budget was briefly in surplus in the late 1990s, before heading into deficit again in the first decade of the 2000s—and especially deep deficits in the 2007-2009 and 2020 recessions. (Source: Federal Reserve Bank of St. Louis (FRED). http://research.stlouisfed.org/fred2/series/FYFSGDA188S)
英語のヒント
連邦政府は何十年も財政赤字を計上してきた。1990年代後半には一時的に黒字となったが、2000年代最初の10年間に再び赤字となり、とくに2007~2009年と2020年の景気後退では深刻な赤字となった。(出典:セントルイス連邦準備銀行〔FRED〕。http://research.stlouisfed.org/fred2/series/FYFSGDA188S)
Federal Surplus or Deficit as a Percentage of Gross Domestic Product
英語のヒント
国内総生産に対する連邦財政黒字または赤字の割合
Debt/GDP Ratio債務のGDP比
Another useful way to view the budget deficit is through the prism of accumulated debt rather than annual deficits. The national debt refers to the total amount that the government has borrowed over time. In contrast, the budget deficit refers to how much the government has borrowed in one particular year. Figure 30.8 shows the ratio of debt/GDP since 1966. Until the 1970s, the debt/GDP ratio revealed a fairly clear pattern of federal borrowing. The government ran up large deficits and raised the debt/GDP ratio in World War II, but from the 1950s to the 1970s the government ran either surpluses or relatively small deficits, and so the debt/GDP ratio drifted down. Large deficits in the 1980s and early 1990s caused the ratio to rise sharply. When budget surpluses arrived from 1998 to 2001, the debt/GDP ratio declined substantially. The budget deficits starting in 2002 then tugged the debt/GDP ratio higher—with a big jump when the recession took hold in 2008–2009. There was another leap in the ratio in 2020.
英語のヒント
財政赤字を見るもう一つの有用な方法は、年間赤字ではなく、累積債務を通して見ることである。国の債務とは、政府が時間を通じて借り入れてきた総額を指す。それに対し、財政赤字は、特定の1年間に政府がいくら借り入れたかを指す。図30.8は、1966年以降の債務/GDP比を示す。1970年代までは、この比率に、連邦借入れのかなり明確な傾向が表れていた。政府は第二次世界大戦中に大きな赤字を積み上げ、債務のGDP比を上げた。しかし、1950~1970年代には、黒字または比較的小さな赤字だったため、債務のGDP比は徐々に下がった。1980年代と1990年代初頭の大幅な赤字により、比率は急上昇した。1998~2001年に財政黒字となると、債務のGDP比は大きく下がった。次に、2002年からの財政赤字がその比率を押し上げ、2008~2009年に景気後退が本格化すると大きく跳ね上がった。2020年にも、比率は再び急上昇した。
Federal Debt as a Percentage of GDP, 1942–2014連邦債務のGDP比、1942~2014年
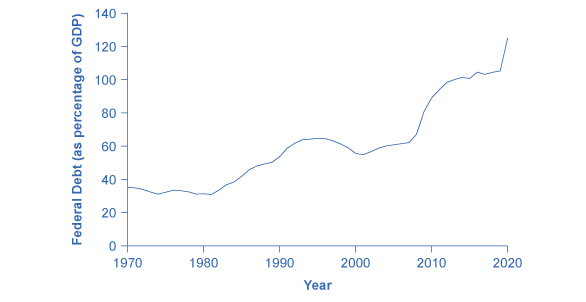
Figure 30.8図 30.8
Federal debt is the sum of annual budget deficits and surpluses. Annual deficits do not always mean that the debt/GDP ratio is rising. During the 1960s and 1970s, the government often ran small deficits, but since the debt was growing more slowly than the economy, the debt/GDP ratio was declining over this time. In the 2008–2009 recession, the debt/GDP ratio rose sharply, before leveling off through the later 2010s. In 2020, it rose sharply again. (Source: https://fred.stlouisfed.org/series/GFDEGDQ188S)
英語のヒント
連邦債務は、毎年の財政赤字と黒字の合計である。年間赤字があるからといって、必ずしも債務のGDP比が上昇するとは限らない。1960年代と1970年代、政府はしばしば小幅な赤字を計上したが、債務の増加が経済の成長より遅かったため、この間の債務のGDP比は低下した。2008~2009年の景気後退では、債務のGDP比が急上昇し、その後2010年代後半を通じて横ばいとなった。2020年には再び急上昇した。(出典:https://fred.stlouisfed.org/series/GFDEGDQ188S)
The next Clear it Up feature discusses how the government handles the national debt.
英語のヒント
次の「疑問を解く」では、政府が国の債務をどのように扱うかを論じる。
Gross Federal Debt as a Percentage of Gross Domestic Product
英語のヒント
国内総生産に対する連邦総債務の割合
The Path from Deficits to Surpluses to Deficits赤字から黒字へ、そして赤字へ至る道筋
Why did the budget deficits suddenly turn to surpluses from 1998 to 2001 and why did the surpluses return to deficits in 2002? Why did the deficit become so large in 2020? Figure 30.9 suggests some answers. The graph combines the earlier information on total federal spending and taxes in a single graph, but focuses on the federal budget since 1990.
英語のヒント
財政赤字は、なぜ1998~2001年に突然黒字へ転じ、2002年には再び赤字へ戻ったのだろうか。なぜ2020年には赤字がそれほど大きくなったのだろうか。図30.9は、いくつかの答えを示唆する。このグラフは、すでに見た連邦支出総額と税収の情報を一つのグラフにまとめ、1990年以降の連邦予算に焦点を当てている。
Total Government Spending and Taxes as a Share of GDP, 1990–2020政府支出総額と税収のGDP比、1990~2020年
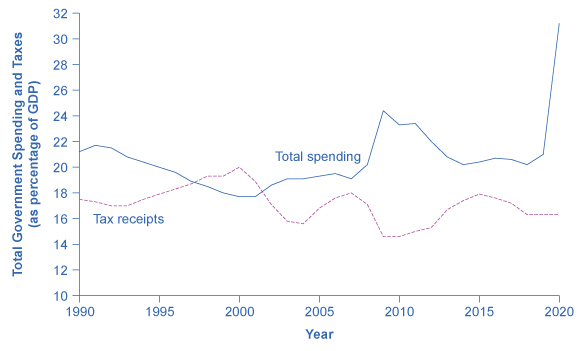


Figure 30.9図 30.9
When government spending exceeds taxes, the gap is the budget deficit. When taxes exceed spending, the gap is a budget surplus. The recessionary period starting in late 2007 saw higher spending and lower taxes, combining to create a large deficit in 2009. The same thing happened in a more extreme way in 2020. (Source: Economic Report of the President, Tables B-46, https://www.govinfo.gov/app/collection/erp/2021)
英語のヒント
政府支出が税収を上回ると、その差が財政赤字となる。税収が支出を上回ると、その差が財政黒字となる。2007年末に始まった景気後退期には、支出の増加と税収の減少が重なり、2009年に大きな赤字が生まれた。2020年には、同じことがさらに極端な形で起きた。(出典:『大統領経済報告』、表B-46、https://www.govinfo.gov/app/collection/erp/2021)
Government spending as a share of GDP declined steadily through the 1990s. The biggest single reason was that defense spending declined from 5.2% of GDP in 1990 to 3.0% in 2000, but interest payments by the federal government also fell by about 1.0% of GDP. However, federal tax collections increased substantially in the later 1990s, jumping from 18.1% of GDP in 1994 to 20.8% in 2000. Powerful economic growth in the late 1990s fueled the boom in taxes. Personal income taxes rise as income goes up; payroll taxes rise as jobs and payrolls go up; corporate income taxes rise as profits go up. At the same time, government spending on transfer payments such as unemployment benefits, foods stamps, and welfare declined with more people working.
英語のヒント
政府支出のGDP比は、1990年代を通じて着実に低下した。単独で最大の理由は、国防支出が1990年のGDPの5.2%から2000年の3.0%へ下がったことだったが、連邦政府の利払いもGDPの約1.0%分減った。しかし、連邦税収は1990年代後半に大きく増え、1994年のGDPの18.1%から2000年の20.8%へ跳ね上がった。1990年代後半の強い経済成長が、税収の急増を支えた。所得が増えると個人所得税が増え、雇用と給与総額が増えると給与税が増え、利益が増えると法人所得税が増える。同時に、働く人が増えたことで、失業給付、フードスタンプ、福祉給付などの移転支出に対する政府支出は減少した。
This sharp increase in tax revenues and decrease in expenditures on transfer payments was largely unexpected even by experienced budget analysts, and so budget surpluses came as a surprise. However, in the early 2000s, many of these factors started running in reverse. Tax revenues sagged, due largely to the recession that started in March 2001, which reduced revenues. Congress enacted a series of tax cuts and President George W. Bush signed them into law, starting in 2001. In addition, government spending swelled due to increases in defense, healthcare, education, Social Security, and support programs for those who were hurt by the recession and the slow growth that followed. Deficits returned. When the severe recession hit in late 2007, spending climbed and tax collections fell to historically unusual levels, resulting in enormous deficits.
英語のヒント
税収の急増と移転支出の減少は、経験豊かな予算分析者にとっても、ほとんど予想外であり、財政黒字は驚きをもって受け止められた。しかし、2000年代初頭には、これらの要因の多くが逆向きに働き始めた。主に2001年3月に始まった景気後退によって、歳入が減り、税収は落ち込んだ。2001年から、議会は一連の減税を可決し、ジョージ・W・ブッシュ大統領が署名して成立させた。さらに、国防、医療、教育、社会保障、景気後退とその後の低成長で被害を受けた人々への支援制度が増加し、政府支出は膨らんだ。赤字が戻った。2007年末に深刻な景気後退が襲うと、支出は増え、税収は歴史的にも異例の水準へ低下し、莫大な赤字となった。
Longer-term U.S. budget forecasts, a decade or more into the future, predict enormous deficits. The higher deficits during the 2007–2009 Great Recession and the 2020 pandemic-induced recession have repercussions, and the demographics will be challenging. The primary reason is the “baby boom”—the exceptionally high birthrates that began in 1946, right after World War II, and lasted for about two decades. Starting in 2010, the front edge of the baby boom generation reached age 65, and in the next two decades, the proportion of Americans over the age of 65 will increase substantially. During the 2020 recession, we saw another wave of early retirements, and we are now in the middle of this major demographic shift. The current level of the payroll taxes that support Social Security and Medicare will fall well short of the projected expenses of these programs, as the following Clear It Up feature shows; thus, the forecast is for increasingly large budget deficits. A decision to collect more revenue to support these programs or to decrease benefit levels would alter this long-term forecast.
英語のヒント
10年以上先を見据えたアメリカの長期予算予測は、莫大な赤字を見込んでいる。2007~2009年の大不況と、2020年のパンデミックによる景気後退で拡大した赤字は、後まで影響し、人口構成も難題を突きつける。主な理由は「ベビーブーム」である。これは第二次世界大戦直後の1946年に始まり、約20年間続いた、例外的に高い出生率を指す。2010年から、ベビーブーム世代の先頭が65歳になり始め、続く20年間には、65歳を超えるアメリカ人の割合が大きく上がる。2020年の景気後退では、早期退職の波が再び見られ、私たちは今、この大きな人口構成変化のただ中にいる。次の「疑問を解く」が示すように、社会保障とメディケアを支える現在の給与税水準は、これらの制度の予測支出を大幅に下回る。そのため、財政赤字はますます大きくなると予測される。これらの制度を支える歳入を増やすか、給付水準を下げる決定をすれば、この長期予測は変わる。