第30章政府予算と財政政策
State and Local Government Spending州・地方政府の支出
Although federal government spending often gets most of the media attention, state and local government spending is also substantial—at about $3.3 trillion in 2021. Figure 30.4 shows that state and local government spending has increased during the last four decades from around 8% to around 14% today. The single biggest item is education, which accounts for about one-third of the total. The rest covers programs like highways, libraries, hospitals and healthcare, parks, and police and fire protection. Unlike the federal government, all states (except Vermont) have balanced budget laws, which means any gaps between revenues and spending must be closed by higher taxes, lower spending, drawing down their previous savings, or some combination of all of these.
英語のヒント
連邦政府の支出がメディアの注目を集めることが多いが、州・地方政府の支出も大きく、2021年には約3.3兆ドルに上った。図30.4は、州・地方政府の支出が、過去40年間に約8%から今日の約14%へ増えたことを示す。単独で最大の項目は教育で、全体の約3分の1を占める。残りは、高速道路、図書館、病院と医療、公園、警察・消防などの事業を賄う。連邦政府と異なり、バーモント州を除くすべての州には均衡予算法がある。つまり、歳入と支出の差は、増税、支出削減、過去の蓄えの取崩し、あるいはそれらの組合せで埋めなければならない。
State and Local Spending, 1960–2020州・地方政府の支出、1960~2020年
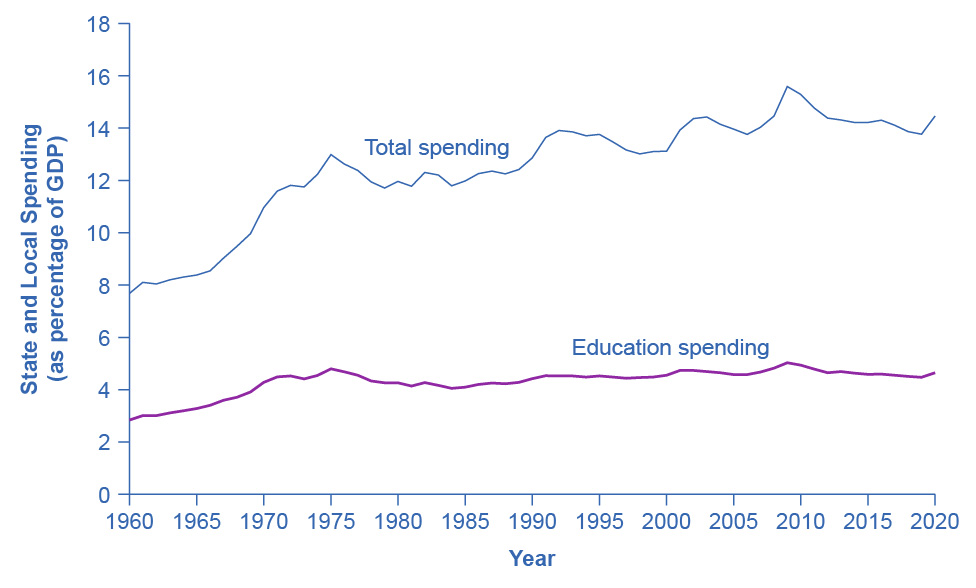

Figure 30.4図 30.4
Spending by state and local government increased from about 10% of GDP in the early 1960s to 14–16% by the mid-1970s. It has remained at roughly that level since. The single biggest spending item is education, including both K–12 spending and support for public colleges and universities, which has been about 4–5% of GDP in recent decades. Source: (Source: Bureau of Economic Analysis, https://apps.bea.gov/iTable/index_nipa.cfm.)
英語のヒント
州・地方政府の支出は、1960年代初頭のGDPの約10%から、1970年代半ばまでに14~16%へ増えた。その後は、ほぼその水準にとどまっている。単独で最大の支出項目は教育であり、幼稚園から第12学年までの支出と、公立大学への支援の両方を含む。近年の数十年間では、GDPの約4~5%である。出典:(出典:経済分析局、https://apps.bea.gov/iTable/index_nipa.cfm.)
U.S. presidential candidates often run for office pledging to improve the public schools or to get tough on crime. However, in the U.S. government system, these tasks are primarily state and local government responsibilities. In fiscal year 2020 state and local governments spent about $970 billion per year on education (including K–12 and college and university education), compared to only $100 billion by the federal government. In other words, about 90 cents of every dollar spent on education happens at the state and local level. A politician who really wants hands-on responsibility for reforming education or reducing crime might do better to run for mayor of a large city or for state governor rather than for president of the United States.
英語のヒント
アメリカの大統領候補は、公立学校の改善や犯罪への厳しい対応を公約に、立候補することが多い。しかし、アメリカの政府制度では、これらは主に州・地方政府の責任である。2020会計年度、州・地方政府は、幼稚園から第12学年までと大学教育を含む教育に、年間約9,700億ドルを支出した。それに対し、連邦政府の支出はわずか1,000億ドルだった。言い換えると、教育への支出1ドル当たり約90セントが、州・地方の段階で支出されている。教育改革や犯罪減少について、実務を担う責任を本当に望む政治家は、アメリカ大統領より、大都市の市長や州知事に立候補する方がよいかもしれない。
Taxes are paid by most, but not all, people who work. Even if you are part of the so-called “1099” or “gig” economy, you are considered an independent contractor and must pay taxes on the income you earn in those occupations. Taxes are also paid by consumers whenever they purchase goods and services. Taxes are used for all sorts of spending—from roads, to bridges, to schools (K–12 and public higher education), to police and other public safety functions. Taxes fund vital public services that support our communities.
英語のヒント
働く人の大半は税を払うが、すべての人ではない。いわゆる「1099」経済や「ギグ」経済で働いていても、独立請負人とみなされ、その職業で得る所得に対して納税しなければならない。消費者も、財・サービスを購入するたびに税を払う。税は、道路、橋、学校、つまり幼稚園から第12学年までと公立高等教育、警察、そのほかの公共の安全を守る機能まで、あらゆる支出に使われる。税は、地域社会を支える不可欠な公共サービスの財源となる。
Key Concepts and Summary重要概念とまとめ
Fiscal policy is the set of policies that relate to federal government spending, taxation, and borrowing. In recent decades, the level of federal government spending and taxes, expressed as a share of GDP, has not changed much, typically fluctuating between about 18% to 22% of GDP. However, the level of state spending and taxes, as a share of GDP, has risen from about 12–13% to about 20% of GDP over the last four decades. The four main areas of federal spending are national defense, Social Security, healthcare, and interest payments, which together account for about 70% of all federal spending. When a government spends more than it collects in taxes, it is said to have a budget deficit. When a government collects more in taxes than it spends, it is said to have a budget surplus. If government spending and taxes are equal, it is said to have a balanced budget. The sum of all past deficits and surpluses make up the government debt.
英語のヒント
財政政策は、連邦政府の支出、課税、借入れに関する一連の政策である。近年の数十年間、連邦政府の支出と税収の水準は、GDP比で見るとあまり変わらず、通常はGDPの約18~22%の間で変動してきた。しかし、州の支出と税収のGDP比は、過去40年間に約12~13%から約20%へ上がった。連邦支出の四つの主要分野は、国防、社会保障、医療、利払いで、合わせて連邦支出全体の約70%を占める。政府が徴収する税より多く支出するとき、財政赤字という。政府が支出より多くの税を徴収するとき、財政黒字という。政府支出と税収が等しいとき、均衡予算という。過去のすべての赤字と黒字の合計が、政府債務を構成する。
Self-Check Questions理解度確認問題
Exercises 1–3練習問題 1–3
Exercise 1問題 1
When governments run budget deficits, how do they make up the differences between tax revenue and spending?
英語のヒント
政府が財政赤字となるとき、税収と支出の差をどのように埋めるか。
Solution解き方
The government borrows funds by selling Treasury bonds, notes, and bills.
英語のヒント
政府は、長期・中期・短期の国債を売って資金を借りる。
Exercise 2問題 2
When governments run budget surpluses, what is done with the extra funds?
英語のヒント
政府が財政黒字となるとき、余剰資金はどう使われるか。
Solution解き方
The funds can be used to pay down the national debt or else be refunded to the taxpayers.
英語のヒント
国の債務の返済に使うか、納税者へ払い戻すことができる。
Exercise 3問題 3
Is it possible for a nation to run budget deficits and still have its debt/GDP ratio fall? Explain your answer. Is it possible for a nation to run budget surpluses and still have its debt/GDP ratio rise? Explain your answer.
英語のヒント
国が財政赤字を計上しながら、債務のGDP比が低下することはありうるか。理由を説明せよ。国が財政黒字を計上しながら、債務のGDP比が上昇することはありうるか。理由を説明せよ。
Solution解き方
Yes, a nation can run budget deficits and see its debt/GDP ratio fall. In fact, this is not uncommon. If the deficit is small in a given year, than the addition to debt in the numerator of the debt/GDP ratio will be relatively small, while the growth in GDP is larger, and so the debt/GDP ratio declines. This was the experience of the U.S. economy for the period from the end of World War II to about 1980. It is also theoretically possible, although not likely, for a nation to have a budget surplus and see its debt/GDP ratio rise. Imagine the case of a nation with a small surplus, but in a recession year when the economy shrinks. It is possible that the decline in the nation’s debt, in the numerator of the debt/GDP ratio, would be proportionally less than the fall in the size of GDP, so the debt/GDP ratio would rise.
英語のヒント
ありうる。国は財政赤字を計上しながら、債務のGDP比が低下することがある。実際、これは珍しくない。ある年の赤字が小さければ、債務/GDP比の分子である債務への追加分は比較的小さい。一方、GDPの増加がそれを上回れば、債務のGDP比は下がる。第二次世界大戦の終わりから1980年ごろまでのアメリカ経済は、これを経験した。また、起こりそうではないものの、国が財政黒字でありながら、債務のGDP比が上がることも、理論上は可能である。小幅な黒字を持つ国が、景気後退で経済が縮小する年を迎えた場合を想像しよう。債務/GDP比の分子である国の債務の減少率が、GDPの規模の縮小率より小さいこともありうる。その場合、債務のGDP比は上がる。