第30章政府予算と財政政策
30.1 Government Spending30.1 政府支出
Learning Objectives学習目標
Learning Objectives学習目標
By the end of this section, you will be able to:
英語のヒント
この節を学ぶと、次のことができるようになる。
- Identify U.S. budget deficit and surplus trends over the past five decades
英語のヒント
過去50年間のアメリカの財政赤字と黒字の傾向を明らかにする - Explain the differences between the U.S. federal budget, and state and local budgets
英語のヒント
アメリカの連邦予算と、州・地方予算の違いを説明する
Government spending covers a range of services that the federal, state, and local governments provide. When the federal government spends more money than it receives in taxes in a given year, it runs a budget deficit. Conversely, when the government receives more money in taxes than it spends in a year, it runs a budget surplus. If government spending and taxes are equal, it has a balanced budget. For example, in 2020, the U.S. government experienced its largest budget deficit ever, as the federal government spent $3.1 trillion more than it collected in taxes. This deficit was about 15% of the size of the U.S. GDP in 2020, making it by far the largest budget deficit relative to GDP since the mammoth borrowing the government used to finance World War II. To put it into perspective, the previous record deficits were experienced during the Great Recession of 2007–2009, when the deficit reached 9.6% of GDP.
英語のヒント
政府支出は、連邦、州、地方政府が提供するさまざまなサービスを対象とする。ある年に、連邦政府の支出額が税収額を上回ると、財政赤字になる。逆に、1年間の政府の税収額が支出額を上回ると、財政黒字になる。政府支出と税収が等しければ、均衡予算である。たとえば2020年、アメリカ政府は史上最大の財政赤字を経験した。連邦政府の支出は、税収を3.1兆ドル上回った。この赤字は、2020年のアメリカGDPの約15%に相当し、第二次世界大戦の資金を賄うための莫大な借入れ以来、GDP比で圧倒的に大きな財政赤字だった。比較のためにいうと、それまでの記録的な赤字は、2007~2009年の大不況中に生じ、GDPの9.6%に達した。
This section presents an overview of government spending in the United States.
英語のヒント
この節では、アメリカの政府支出を概観する。
Total U.S. Government Spendingアメリカの政府支出総額
Federal spending in nominal dollars (that is, dollars not adjusted for inflation) has grown by a multiple of more than 38 over the last four decades, from $93.4 billion in 1960 to $6.8 trillion in 2020. Comparing spending over time in nominal dollars is misleading because it does not take into account inflation or growth in population and the real economy. A more useful method of comparison is to examine government spending as a percent of GDP over time.
英語のヒント
名目ドル、つまりインフレ調整をしていないドルで測った連邦支出は、過去40年間に38倍超となり、1960年の934億ドルから2020年の6.8兆ドルへ増えた。名目ドルで支出を時系列比較すると、誤解を招く。インフレ、人口増加、実体経済の成長を考慮しないからである。より有用な比較方法は、GDPに対する政府支出の割合を、時間を追って調べることである。
The top line in Figure 30.2 shows the federal spending level since 1960, expressed as a share of GDP. Despite a widespread sense among many Americans that the federal government has been growing steadily larger, the graph shows that federal spending has hovered in a range from 18% to 22% of GDP most of the time since 1960. For example, throughout the latter part of the 2010s, government expenditures were around 20% of GDP. The other lines in Figure 30.2 show the major federal spending categories: national defense, Social Security, health programs, and interest payments. From the graph, we see that national defense spending as a share of GDP has generally declined since the 1960s, although there were some upward bumps in the 1980s buildup under President Ronald Reagan and in the aftermath of the terrorist attacks on September 11, 2001. In contrast, Social Security and healthcare have grown steadily as a percent of GDP. Healthcare expenditures include both payments for senior citizens (Medicare), and payments for low-income Americans (Medicaid). State governments also partially fund Medicaid. Interest payments are the final main category of government spending in Figure 30.2.
英語のヒント
図30.2の最上段の線は、1960年以降の連邦支出の水準を、GDPに対する割合で示す。多くのアメリカ人には、連邦政府が着実に大きくなり続けているという感覚が広まっている。しかし、このグラフでは、1960年以降のほとんどの期間、連邦支出はGDPの18~22%の範囲で推移している。たとえば、2010年代後半を通じて、政府支出はGDPの約20%だった。図30.2のほかの線は、連邦支出の主要な分類、すなわち国防、社会保障、医療制度、利払いを示す。グラフから、国防支出のGDP比は1960年代以降、概して低下したとわかる。ただし、ロナルド・レーガン大統領の下での1980年代の増強時と、2001年9月11日のテロ攻撃の後には、いくらか上昇した。これに対して、社会保障と医療は、GDP比で着実に増えてきた。医療支出には、高齢者向けの支払いであるメディケアと、低所得のアメリカ人向けの支払いであるメディケイドの両方が含まれる。州政府もメディケイドの一部を負担する。利払いは、この図に示す政府支出の最後の主要分類である。
Federal Spending, 1960–2020連邦支出、1960~2020年
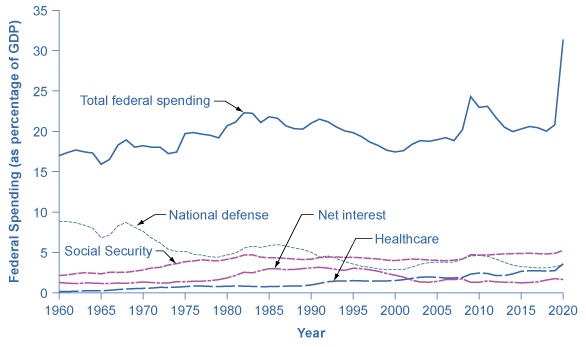
Figure 30.2図 30.2
Since 1960, total federal spending has ranged from about 18% to 22% of GDP. It climbed above that level in 2009, quickly dropped back down to that level by 2013, and again climbed above that level in 2020. The share that the government has spent on national defense has generally declined, while the share it has spent on Social Security and on healthcare expenses (mainly Medicare and Medicaid) has increased. (Source: Economic Report of the President, 2021, Table B47, https://www.govinfo.gov/app/collection/erp/2021)
英語のヒント
1960年以降、連邦支出総額はGDPの約18~22%の範囲で推移してきた。2009年にはその水準を上回り、2013年までに急速にその水準へ戻り、2020年には再び上回った。政府が国防に使う割合は概して低下し、社会保障と、主にメディケアおよびメディケイドからなる医療費に使う割合は増えた。(出典:『大統領経済報告』2021年、表B47、https://www.govinfo.gov/app/collection/erp/2021)
Each year, the government borrows funds from U.S. citizens and foreigners to cover its budget deficits. It does this by selling securities (Treasury bonds, notes, and bills)—in essence borrowing from the public and promising to repay with interest in the future. From 1961 to 1997, the U.S. government has run budget deficits, and thus borrowed funds, in almost every year. It had budget surpluses from 1998 to 2001, and then returned to deficits.
英語のヒント
政府は毎年、財政赤字を賄うため、アメリカの市民や外国人から資金を借りる。これは、長期・中期・短期の国債を売ることで行う。要するに、公衆から借り入れ、将来利息を付けて返すと約束するのである。1961~1997年、アメリカ政府はほぼ毎年、財政赤字となり、資金を借り入れた。1998~2001年には財政黒字となったが、その後、赤字へ戻った。
The interest payments on past federal government borrowing were typically 1–2% of GDP in the 1960s and 1970s but then climbed above 3% of GDP in the 1980s and stayed there until the late 1990s. The government was able to repay some of its past borrowing by running surpluses from 1998 to 2001 and, with help from low interest rates, the interest payments on past federal government borrowing had fallen back to 1.6% of GDP by 2020.
英語のヒント
過去の連邦政府の借入れに対する利払いは、1960年代と1970年代には通常GDPの1~2%だったが、1980年代にはGDPの3%を超え、1990年代後半までその水準にとどまった。政府は1998~2001年に黒字を計上して、過去の借入れの一部を返済できた。低金利にも助けられ、過去の連邦政府の借入れに対する利払いは、2020年までにGDPの1.6%へ戻った。
We investigate the government borrowing and debt patterns in more detail later in this chapter, but first we need to clarify the difference between the deficit and the debt. The deficit is not the debt. The difference between the deficit and the debt lies in the time frame. The government deficit (or surplus) refers to what happens with the federal government budget each year. The government debt is accumulated over time. It is the sum of all past deficits and surpluses. If you borrow $10,000 per year for each of the four years of college, you might say that your annual deficit was $10,000, but your accumulated debt over the four years is $40,000.
英語のヒント
政府の借入れと債務の傾向は、この章の後半で詳しく調べるが、まず、赤字と債務の違いを明確にする必要がある。赤字は債務ではない。両者の違いは時間枠にある。政府の赤字または黒字は、毎年の連邦政府予算に何が起きるかを指す。政府債務は、時間とともに累積する。それは過去のすべての赤字と黒字の合計である。大学の4年間、毎年10,000ドルを借りるなら、年間赤字は10,000ドルだったといえるが、4年間の累積債務は40,000ドルである。
These four categories—national defense, Social Security, healthcare, and interest payments—generally account for roughly 60% of all federal spending, as Figure 30.3 shows. (Due to the large amount of one-time expenditures by the federal government in 2020 due to the pandemic, the 2019 statistics are presented here.) The remaining 40% wedge of the pie chart covers all other categories of federal government spending: international affairs; science and technology; natural resources and the environment; transportation; housing; education; income support for people in poverty; community and regional development; law enforcement and the judicial system; and the administrative costs of running the government.
英語のヒント
図30.3のように、国防、社会保障、医療、利払いという四つの分類は、一般に連邦支出全体の約60%を占める。(2020年には、パンデミックによる一時的な連邦政府支出が多額に上ったため、ここでは2019年の統計を示す。)円グラフの残る40%の部分は、それ以外のすべての連邦政府支出を含む。国際問題、科学技術、天然資源と環境、交通、住宅、教育、貧困層への所得支援、地域社会・地域開発、法執行と司法制度、そして政府運営の行政費用である。
Slices of Federal Spending, 2019連邦支出の内訳、2019年
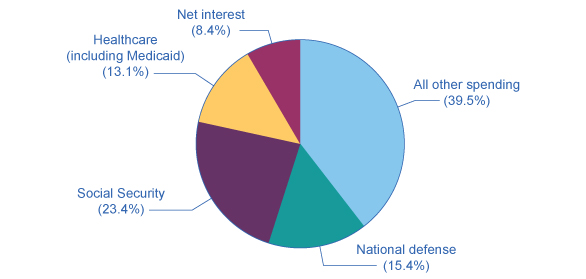


Figure 30.3図 30.3
About 60% of government spending goes to four major areas: national defense, Social Security, healthcare, and interest payments on past borrowing. This leaves about 40% of federal spending for all other functions of the U.S. government. (Source: https://www.whitehouse.gov/omb/budget/Historicals/)
英語のヒント
政府支出の約60%は、国防、社会保障、医療、過去の借入れへの利払いという四つの主要分野に向かう。残る連邦支出の約40%で、アメリカ政府のその他すべての機能を賄う。(出典:https://www.whitehouse.gov/omb/budget/Historicals/)