付録
The Expenditure-Output Model支出・産出モデル
(This appendix should be consulted after first reading The Aggregate Demand/Aggregate Supply Model and The Keynesian Perspective.) The fundamental ideas of Keynesian economics were developed before the AD/AS model was popularized. From the 1930s until the 1970s, Keynesian economics was usually explained with a different model, known as the expenditure-output approach. This approach is strongly rooted in the fundamental assumptions of Keynesian economics: it focuses on the total amount of spending in the economy, with no explicit mention of aggregate supply or of the price level (although as you will see, it is possible to draw some inferences about aggregate supply and price levels based on the diagram).
英語のヒント
(この付録は、まず「総需要・総供給モデル」と「ケインズ派の見方」を読んだ後で参照してほしい。)ケインズ経済学の基本的な考えは、AD・ASモデルが普及する前に発展した。1930年代から1970年代まで、ケインズ経済学は通常、支出・産出アプローチと呼ばれる別のモデルで説明されていた。このアプローチは、ケインズ経済学の基本的な仮定に深く根ざしている。経済全体の支出額に焦点を当て、総供給や物価水準に明示的には言及しない(ただし、これから見るように、図に基づいて総供給や物価水準について推論することはできる)。
The Axes of the Expenditure-Output Diagram支出・産出図の軸
The expenditure-output model, sometimes also called the Keynesian cross diagram, determines the equilibrium level of real GDP by the point where the total or aggregate expenditures in the economy are equal to the amount of output produced. The axes of the Keynesian cross diagram presented in Figure D.1 show real GDP on the horizontal axis as a measure of output and aggregate expenditures on the vertical axis as a measure of spending.
英語のヒント
支出・産出モデルは、ケインズの交差図とも呼ばれ、経済の総支出が生産量と等しくなる点によって、均衡実質GDPを決める。図D.1に示すケインズの交差図では、生産量の尺度である実質GDPを横軸に、支出の尺度である総支出を縦軸に取る。
The Expenditure-Output Diagram支出・産出図
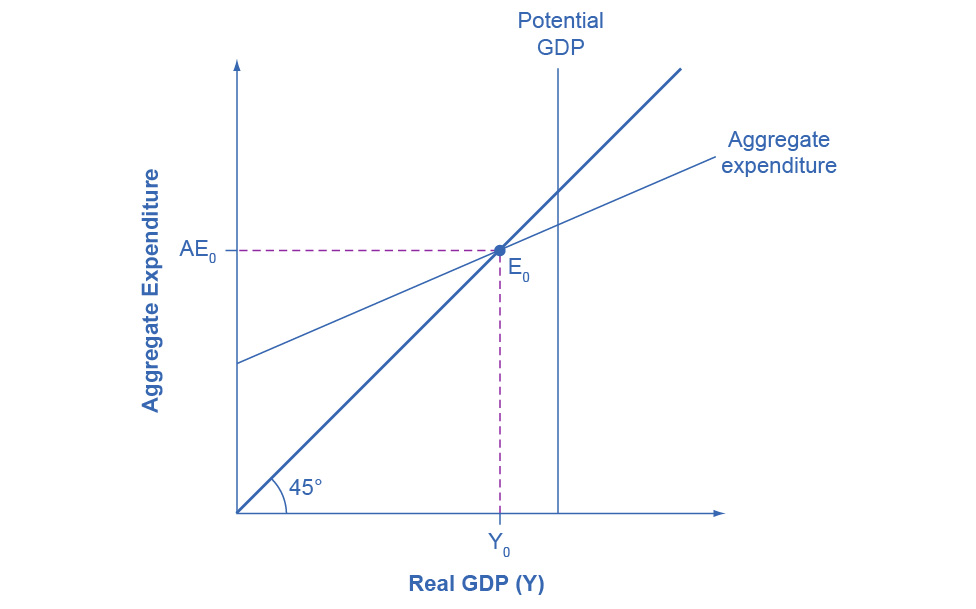

Figure D.1図 D.1
The aggregate expenditure-output model shows aggregate expenditures on the vertical axis and real GDP on the horizontal axis. A vertical line shows potential GDP where full employment occurs. The 45-degree line shows all points where aggregate expenditures and output are equal. The aggregate expenditure schedule shows how total spending or aggregate expenditure increases as output or real GDP rises. The intersection of the aggregate expenditure schedule and the 45-degree line will be the equilibrium. Equilibrium occurs at E0, where aggregate expenditure AE0 is equal to the output level Y0.
英語のヒント
総支出・産出モデルは、縦軸に総支出、横軸に実質GDPを示す。垂直線は、完全雇用が実現する潜在GDPを示す。45度線は、総支出と産出量が等しいすべての点を示す。総支出曲線は、産出量または実質GDPが増えるにつれて、支出全体または総支出がどう増えるかを示す。総支出曲線と45度線の交点が均衡になる。均衡はE0で生じ、そこで総支出AE0は産出水準Y0と等しい。
Remember that GDP can be thought of in several equivalent ways: it measures both the value of spending on final goods and also the value of the production of final goods. All sales of the final goods and services that make up GDP will eventually end up as income for workers, for managers, and for investors and owners of firms. The sum of all the income received for contributing resources to GDP is called national income (Y). At some points in the discussion that follows, it will be useful to refer to real GDP as “national income.” Both axes are measured in real (inflation-adjusted) terms.
英語のヒント
GDPは、同等ないくつかの方法で捉えられることを思い出そう。最終財への支出額と、最終財の生産価値の両方を測る。GDPを構成する最終財・サービスの販売額はすべて、最終的には労働者、経営者、投資家、企業所有者の所得になる。GDPに資源を提供して受け取るすべての所得の合計を、国民所得(Y)と呼ぶ。以下の議論では、実質GDPを「国民所得」と呼ぶと便利な箇所がある。両軸とも、実質、すなわちインフレ調整済みの値で測る。
The Potential GDP Line and the 45-degree Line
英語のヒント
潜在GDP線と45度線
The Keynesian cross diagram contains two lines that serve as conceptual guideposts to orient the discussion. The first is a vertical line showing the level of potential GDP. Potential GDP means the same thing here that it means in the AD/AS diagrams: it refers to the quantity of output that the economy can produce with full employment of its labor and physical capital.
英語のヒント
ケインズの交差図には、議論の方向を示す概念的な道標として二つの線が含まれる。一つ目は潜在GDPの水準を示す垂直線である。ここでの潜在GDPの意味はAD・AS図と同じであり、経済が労働と物的資本を完全雇用して生産できる産出量を指す。
The second conceptual line on the Keynesian cross diagram is the 45-degree line, which starts at the origin and reaches up and to the right. A line that stretches up at a 45-degree angle represents the set of points (1, 1), (2, 2), (3, 3) and so on, where the measurement on the vertical axis is equal to the measurement on the horizontal axis. In this diagram, the 45-degree line shows the set of points where the level of aggregate expenditure in the economy, measured on the vertical axis, is equal to the level of output or national income in the economy, measured by GDP on the horizontal axis.
英語のヒント
ケインズの交差図の二つ目の概念的な線は、原点から右上に伸びる45度線である。45度の角度で上昇する線は、(1, 1)、(2, 2)、(3, 3)など、縦軸の値と横軸の値が等しい点の集合を表す。この図の45度線は、縦軸で測る経済の総支出の水準と、横軸のGDPで測る経済の産出量または国民所得の水準が等しい点の集合を示す。
When the macroeconomy is in equilibrium, it must be true that the aggregate expenditures in the economy are equal to the real GDP—because by definition, GDP is the measure of what is spent on final sales of goods and services in the economy. Thus, the equilibrium calculated with a Keynesian cross diagram will always end up where aggregate expenditure and output are equal—which will only occur along the 45-degree line.
英語のヒント
マクロ経済が均衡にあるとき、経済の総支出は実質GDPに等しくなければならない。GDPは定義上、経済における財・サービスの最終販売への支出を測るからである。したがって、ケインズの交差図で求める均衡は、必ず総支出と産出量が等しいところに位置し、それは45度線上でしか生じない。
The Aggregate Expenditure Schedule
英語のヒント
総支出曲線
The final ingredient of the Keynesian cross or expenditure-output diagram is the aggregate expenditure schedule, which will show the total expenditures in the economy for each level of real GDP. The intersection of the aggregate expenditure line with the 45-degree line—at point E0 in Figure D.1—will show the equilibrium for the economy, because it is the point where aggregate expenditure is equal to output or real GDP. After developing an understanding of what the aggregate expenditures schedule means, we will return to this equilibrium and how to interpret it.
英語のヒント
ケインズの交差図、または支出・産出図の最後の要素は、実質GDPの各水準に対する経済の総支出を示す総支出曲線である。図D.1のE0点にある総支出線と45度線の交点は、総支出が産出量、または実質GDPに等しい点なので、経済の均衡を示す。総支出曲線の意味を理解した後で、この均衡とその解釈に戻る。