付録
Taking both effects together, the substitution effect is encouraging Quentin toward more present and less future consumption, because present consumption is relatively cheaper, while the income effect is encouraging him to less present and less future consumption, because the lower interest rate is pushing him to a lower level of utility. For Quentin’s personal preferences, the substitution effect is stronger so that, overall, he reacts to the lower rate of return with more present consumption and less savings at choice B. However, other people might have different preferences. They might react to a lower rate of return by choosing the same level of present consumption and savings at choice D, or by choosing less present consumption and more savings at a point like F. For these other sets of preferences, the income effect of a lower rate of return on present consumption would be relatively stronger, while the substitution effect would be relatively weaker.
英語のヒント
二つを合わせると、代替効果は現在の消費が相対的に安くなるため、現在を増やし将来を減らすよう促す。所得効果は低い利子率で効用が下がるため、現在も将来も減らすよう促す。クエンティンの好みでは代替効果が強く、全体としてBで現在の消費を増やし貯蓄を減らす。しかし他の人なら、Dで現在の消費と貯蓄を同じにするか、Fのように現在の消費を減らし貯蓄を増やすかもしれない。これらの好みでは、低い収益率が現在の消費に与える所得効果が相対的に強く、代替効果が弱い。
Sketching Substitution and Income Effects代替効果と所得効果の作図
Indifference curves provide an analytical tool for looking at all the choices that provide a single level of utility. They eliminate any need for placing numerical values on utility and help to illuminate the process of making utility-maximizing decisions. They also provide the basis for a more detailed investigation of the complementary motivations that arise in response to a change in a price, wage or rate of return—namely, the substitution and income effects.
英語のヒント
無差別曲線は、同じ効用を与える選択肢すべてを調べる分析道具だ。効用に数値を付ける必要がなく、効用最大化の意思決定を明らかにする。価格、賃金、収益率の変化に伴う二つの動機、代替効果と所得効果を詳しく調べる基礎にもなる。
If you are finding it a little tricky to sketch diagrams that show substitution and income effects so that the points of tangency all come out correctly, it may be useful to follow this procedure.
英語のヒント
接点がすべて正しくなるよう二つの効果を描くのが難しければ、次の手順に従うと役立つ。
Step 1. Begin with a budget constraint showing the choice between two goods, which this example will call “candy” and “movies.” Choose a point A which will be the optimal choice, where the indifference curve will be tangent—but it is often easier not to draw in the indifference curve just yet. See Figure B.7.
英語のヒント
手順1:ここでは「菓子」と「映画」とする二つの財の予算制約から始める。無差別曲線が接して最適になる点Aを選ぶ。ただし、この時点では曲線をまだ描かない方が簡単なことが多い。図B.7を見よう。
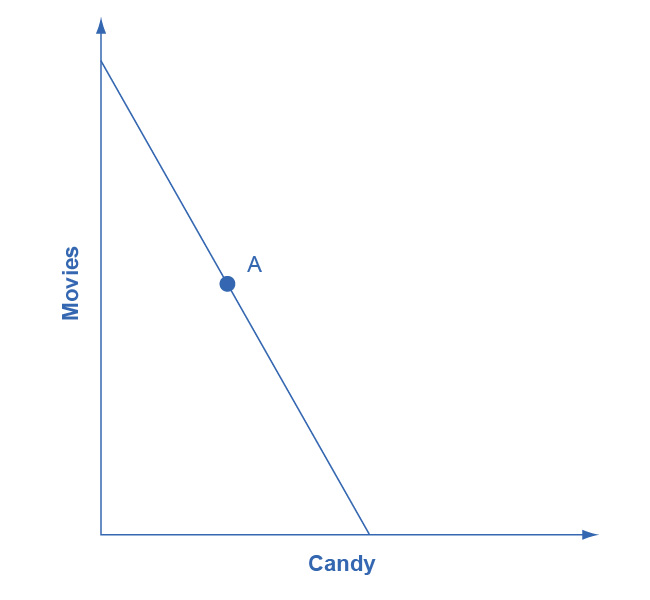
Figure B.7図 B.7
Step 2. Now the price of movies changes: let’s say that it rises. That shifts the budget set inward. You know that the higher price will push the decision-maker down to a lower level of utility, represented by a lower indifference curve. But at this stage, draw only the new budget set. See Figure B.8.
英語のヒント
手順2:映画の価格が変わり、ここでは値上がりするとする。予算集合は内側へ移る。高い価格は低い無差別曲線が示す低い効用へ押し下げるが、まだ新しい予算集合だけを描く。図B.8を見よう。
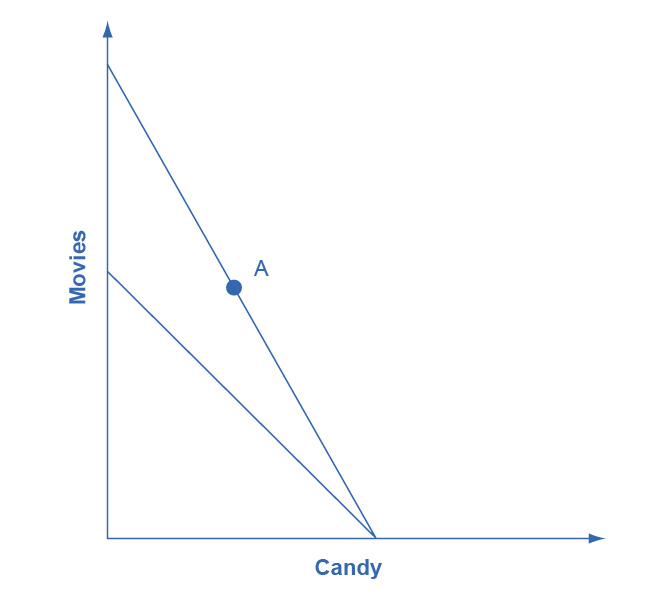
Figure B.8図 B.8
Step 3. The key tool in distinguishing between substitution and income effects is to insert a dashed line, parallel to the new budget line. This line is a graphical tool that allows you to distinguish between the two changes: (1) the effect on consumption of the two goods of the shift in prices—with the level of utility remaining unchanged—which is the substitution effect; and (2) the effect on consumption of the two goods of shifting from one indifference curve to the other—with relative prices staying unchanged—which is the income effect. The dashed line is inserted in this step. The trick is to have the dashed line travel close to the original choice A, but not directly through point A. See Figure B.9.
英語のヒント
手順3:二つの効果を分ける鍵は、新しい予算線に平行な破線を入れることだ。これにより、効用を一定にして価格を変えたときの両財の消費への影響(代替効果)と、相対価格を一定にして無差別曲線を移ったときの影響(所得効果)を分けられる。破線を元のAの近くに置くが、Aそのものは通さないのがこつだ。図B.9を見よう。
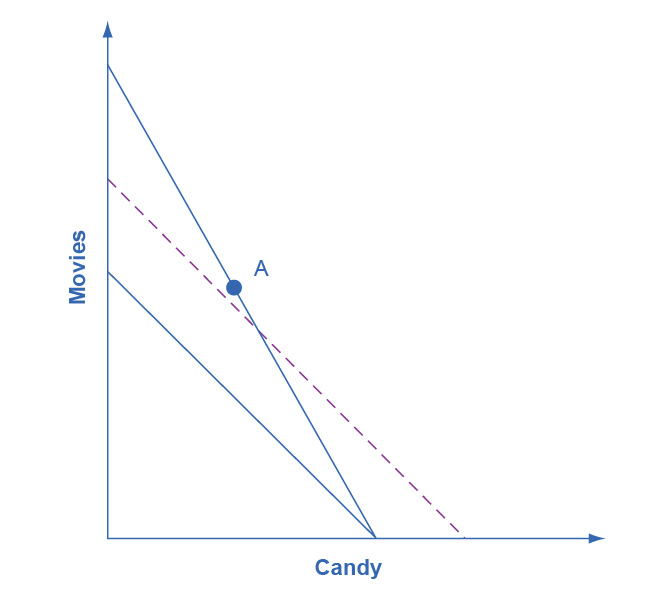
Figure B.9図 B.9
Step 4. Now, draw the original indifference curve, so that it is tangent to both point A on the original budget line and to a point C on the dashed line. Many students find it easiest to first select the tangency point C where the original indifference curve touches the dashed line, and then to draw the original indifference curve through A and C. The substitution effect is illustrated by the movement along the original indifference curve as prices change but the level of utility holds constant, from A to C. As expected, the substitution effect leads to less consumed of the good that is relatively more expensive, as shown by the “s” (substitution) arrow on the vertical axis, and more consumed of the good that is relatively less expensive, as shown by the “s” arrow on the horizontal axis. See Figure B.10.
英語のヒント
手順4:元の予算線上のAと、破線上のCの両方で接するよう、元の無差別曲線を描く。先に破線上の接点Cを選び、AとCを通る曲線を描くと簡単だと感じる学生が多い。AからCへの移動は、価格が変わっても効用を一定に保つ、元の無差別曲線上の代替効果だ。予想どおり、相対的に高い財は減り、安い財は増える。縦軸と横軸のs(代替)の矢印がそれぞれを示す。図B.10を見よう。
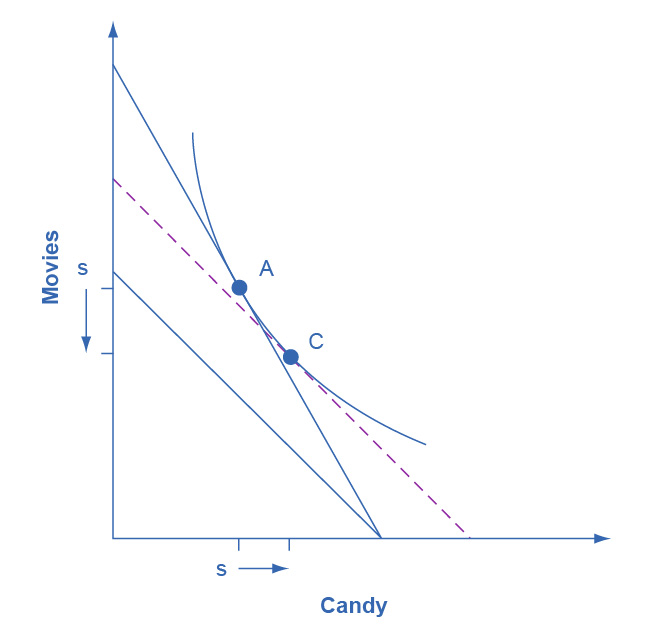
Figure B.10図 B.10
Step 5. With the substitution effect in place, now choose utility-maximizing point B on the new opportunity set. When you choose point B, think about whether you wish the substitution or the income effect to have a larger impact on the good (in this case, candy) on the horizontal axis. If you choose point B to be directly in a vertical line with point A (as is illustrated here), then the income effect will be exactly offsetting the substitution effect on the horizontal axis. If you insert point B so that it lies a little to right of the original point A, then the substitution effect will exceed the income effect. If you insert point B so that it lies a little to the left of point A, then the income effect will exceed the substitution effect. The income effect is the movement from C to B, showing how choices shifted as a result of the decline in buying power and the movement between two levels of utility, with relative prices remaining the same. With normal goods, the negative income effect means less consumed of each good, as shown by the direction of the “i” (income effect) arrows on the vertical and horizontal axes. See Figure B.11.
英語のヒント
手順5:代替効果を描いたら、新しい機会集合上に効用最大化点Bを選ぶ。横軸の財、ここでは菓子について、代替効果と所得効果のどちらを強くしたいか考えよう。図のようにBをAと同じ縦線上に置けば、横軸の財への所得効果と代替効果がちょうど相殺する。BをAより少し右へ置けば代替効果が大きく、少し左へ置けば所得効果が大きくなる。CからBが所得効果だ。相対価格を変えず、購買力の低下によって効用水準が変わると、選択がどう移るかを示す。上級財なら負の所得効果で両財とも消費が減り、縦横の軸のi(所得効果)の矢印がその向きを示す。図B.11を見よう。
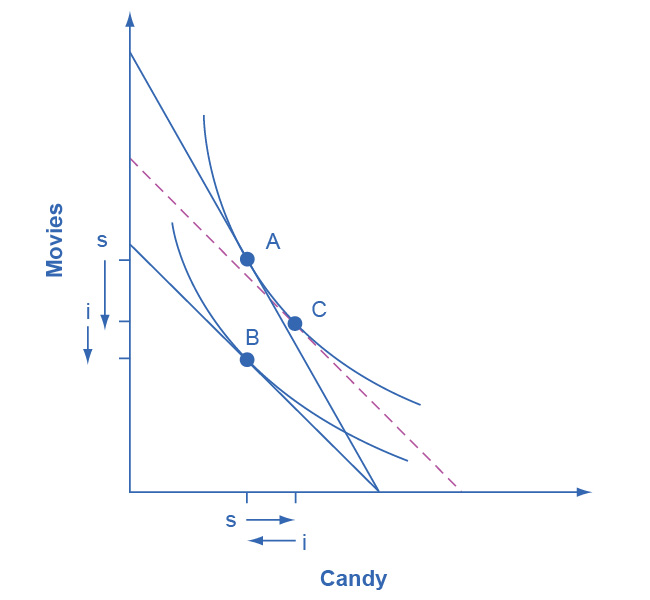


Figure B.11図 B.11
In sketching substitution and income effect diagrams, you may wish to practice some of the following variations: (1) Price falls instead of a rising; (2) The price change affects the good on either the vertical or the horizontal axis; (3) Sketch these diagrams so that the substitution effect exceeds the income effect; the income effect exceeds the substitution effect; and the two effects are equal.
英語のヒント
作図では、次の変化も練習するとよい。(1)値上げでなく値下げ。(2)価格が変わる財を縦軸または横軸に置く。(3)代替効果が所得効果より大きい場合、所得効果が大きい場合、両者が等しい場合を描く。
One final note: The helpful dashed line can be drawn tangent to the new indifference curve, and parallel to the original budget line, rather than tangent to the original indifference curve and parallel to the new budget line. Some students find this approach more intuitively clear. The answers you get about the direction and relative sizes of the substitution and income effects, however, should be the same.
英語のヒント
最後にもう一点。破線は、元の無差別曲線に接して新しい予算線に平行にする代わりに、新しい無差別曲線に接して元の予算線に平行に描くこともできる。その方が直感的に分かりやすいと感じる学生もいる。ただし、代替効果と所得効果の向きと相対的な大きさについての答えは、同じになるはずだ。