付録
Equilibrium in the Keynesian Cross Modelケインズの交差モデルの均衡
With the aggregate expenditure line in place, the next step is to relate it to the two other elements of the Keynesian cross diagram. Thus, the first subsection interprets the intersection of the aggregate expenditure function and the 45-degree line, while the next subsection relates this point of intersection to the potential GDP line.
英語のヒント
総支出線ができたので、次はそれをケインズの交差図の他の二つの要素と結びつける。まず最初の小節では総支出関数と45度線の交点を解釈し、次の小節で、この交点を潜在GDP線と関連づける。
Where Equilibrium Occurs
英語のヒント
均衡が生じる場所
The point where the aggregate expenditure line that is constructed from C + I + G + X – M crosses the 45-degree line will be the equilibrium for the economy. It is the only point on the aggregate expenditure line where the total amount being spent on aggregate demand equals the total level of production. In Figure D.7, this point of equilibrium (E0) happens at 6,000, which can also be read off Table D.3.
英語のヒント
The meaning of “equilibrium” remains the same; that is, equilibrium is a point of balance where no incentive exists to shift away from that outcome. To understand why the point of intersection between the aggregate expenditure function and the 45-degree line is a macroeconomic equilibrium, consider what would happen if an economy found itself to the right of the equilibrium point E, say point H in Figure D.8, where output is higher than the equilibrium. At point H, the level of aggregate expenditure is below the 45-degree line, so that the level of aggregate expenditure in the economy is less than the level of output. As a result, at point H, output is piling up unsold—not a sustainable state of affairs.
英語のヒント
「均衡」の意味は変わらない。つまり、均衡は、その結果から離れる誘因が存在しない釣り合いの点である。総支出関数と45度線の交点がマクロ経済の均衡である理由を理解するため、経済が均衡点Eの右側、たとえば図D.8のH点にあり、生産が均衡より高い場合に何が起こるかを考えよう。H点では総支出水準は45度線より下にあり、経済の総支出水準は産出水準を下回る。その結果、H点では生産物が売れ残って積み上がり、持続できない状態となる。
Equilibrium in the Keynesian Cross Diagramケインズの交差図における均衡
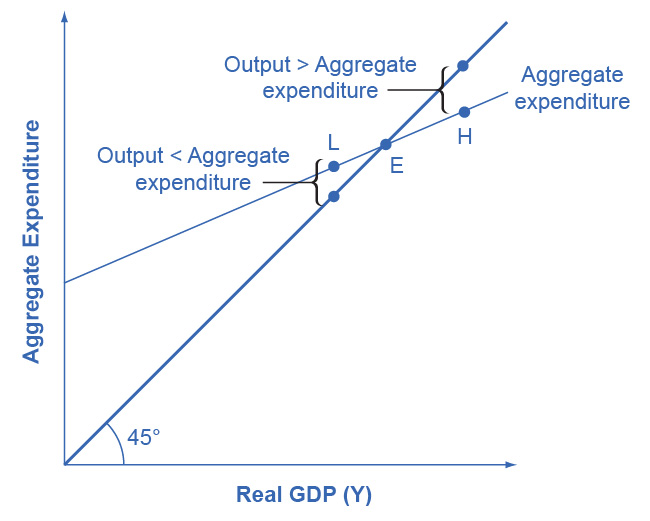
Figure D.8図 D.8
If output was above the equilibrium level, at H, then the real output is greater than the aggregate expenditure in the economy. This pattern cannot hold, because it would mean that goods are produced but piling up unsold. If output was below the equilibrium level at L, then aggregate expenditure would be greater than output. This pattern cannot hold either, because it would mean that spending exceeds the number of goods being produced. Only point E can be at equilibrium, where output, or national income and aggregate expenditure, are equal. The equilibrium (E) must lie on the 45-degree line, which is the set of points where national income and aggregate expenditure are equal.
英語のヒント
生産がH点で均衡水準を上回るなら、実質産出量は経済の総支出より大きい。この状態は、財が生産されても売れ残って積み上がることを意味するので続かない。生産がL点で均衡水準を下回るなら、総支出は産出量より大きい。この状態も、生産される財の量を支出が上回ることを意味するので続かない。産出量、または国民所得と総支出が等しいE点だけが均衡となりうる。均衡Eは、国民所得と総支出が等しい点の集合である45度線上になければならない。
Conversely, consider the situation where the level of output is at point L—where real output is lower than the equilibrium. In that case, the level of aggregate demand in the economy is above the 45-degree line, indicating that the level of aggregate expenditure in the economy is greater than the level of output. When the level of aggregate demand has emptied the store shelves, it cannot be sustained, either. Firms will respond by increasing their level of production. Thus, the equilibrium must be the point where the amount produced and the amount spent are in balance, at the intersection of the aggregate expenditure function and the 45-degree line.
英語のヒント
逆に、生産水準がL点にあり、実質産出量が均衡より低い状況を考えよう。その場合、経済の総需要水準は45度線より上にあり、総支出水準が産出水準より大きいことを示す。その総需要によって店の棚が空になるなら、その状態も維持できない。企業は生産水準を引き上げて対応する。したがって、均衡は生産額と支出額が釣り合う点、すなわち総支出関数と45度線の交点でなければならない。
Recessionary and Inflationary Gaps
英語のヒント
景気後退ギャップとインフレ・ギャップ
In the Keynesian cross diagram, if the aggregate expenditure line intersects the 45-degree line at the level of potential GDP, then the economy is in sound shape. There is no recession, and unemployment is low. But there is no guarantee that the equilibrium will occur at the potential GDP level of output. The equilibrium might be higher or lower.
英語のヒント
ケインズの交差図で、総支出線が潜在GDPの水準で45度線と交わるなら、経済は健全な状態にある。景気後退はなく、失業率は低い。しかし、均衡が潜在GDPの産出水準で生じる保証はない。均衡はそれより高い場合も低い場合もある。
For example, Figure D.9 (a) illustrates a situation where the aggregate expenditure line intersects the 45-degree line at point E0, which is a real GDP of $6,000, and which is below the potential GDP of $7,000. In this situation, the level of aggregate expenditure is too low for GDP to reach its full employment level, and unemployment will occur. The distance between an output level like E0 that is below potential GDP and the level of potential GDP is called a recessionary gap. Because the equilibrium level of real GDP is so low, firms will not wish to hire the full employment number of workers, and unemployment will be high.
英語のヒント
たとえば図D.9(a)は、総支出線がE0点で45度線と交わる状況を示す。この点の実質GDPは6,000ドルであり、潜在GDPの7,000ドルを下回る。この状況では、GDPが完全雇用水準に達するには総支出水準が低すぎ、失業が生じる。潜在GDPを下回るE0のような産出水準と潜在GDP水準の距離を、景気後退ギャップと呼ぶ。均衡実質GDPが低いため、企業は完全雇用に必要な人数を雇おうとせず、失業率は高くなる。
Addressing Recessionary and Inflationary Gaps景気後退ギャップとインフレ・ギャップへの対応
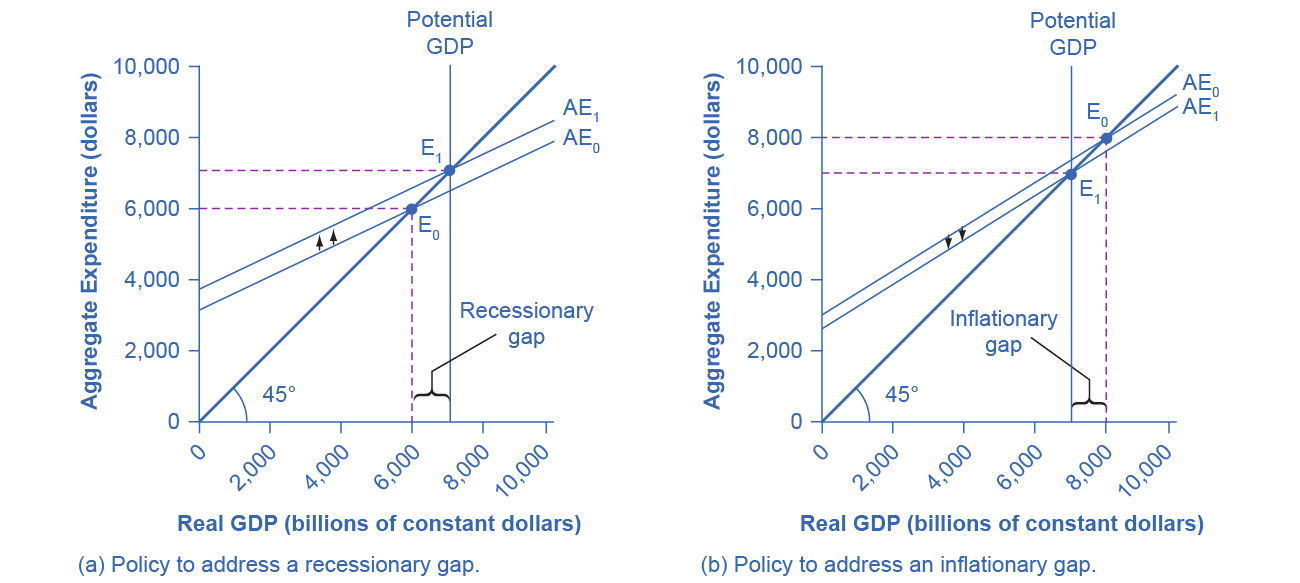


Figure D.9図 D.9
(a) If the equilibrium occurs at an output below potential GDP, then a recessionary gap exists. The policy solution to a recessionary gap is to shift the aggregate expenditure schedule up from AE0 to AE1, using policies like tax cuts or government spending increases. Then the new equilibrium E1 occurs at potential GDP. (b) If the equilibrium occurs at an output above potential GDP, then an inflationary gap exists. The policy solution to an inflationary gap is to shift the aggregate expenditure schedule down from AE0 to AE1, using policies like tax increases or spending cuts. Then, the new equilibrium E1 occurs at potential GDP.
英語のヒント
(a)均衡が潜在GDPを下回る産出量で生じれば、景気後退ギャップが存在する。政策的な解決策は、減税や政府支出の増加を用い、総支出曲線をAE0からAE1へ上方移動させることである。そうすると、新しい均衡E1は潜在GDPで生じる。(b)均衡が潜在GDPを上回る産出量で生じれば、インフレ・ギャップが存在する。政策的な解決策は、増税や支出削減を用い、総支出曲線をAE0からAE1へ下方移動させることである。そうすると、新しい均衡E1は潜在GDPで生じる。
What might cause a recessionary gap? Anything that shifts the aggregate expenditure line down is a potential cause of recession, including a decline in consumption, a rise in savings, a fall in investment, a drop in government spending or a rise in taxes, or a fall in exports or a rise in imports. Moreover, an economy that is at equilibrium with a recessionary gap may just stay there and suffer high unemployment for a long time; remember, the meaning of equilibrium is that there is no particular adjustment of prices or quantities in the economy to chase the recession away.
英語のヒント
何が景気後退ギャップを生むのだろうか。消費の減少、貯蓄の増加、投資の減少、政府支出の減少や増税、輸出の減少や輸入の増加など、総支出線を下へ動かすものはすべて景気後退の潜在的な原因となる。さらに、景気後退ギャップを伴う均衡にある経済は、そのままとどまり、長期間高い失業に苦しむかもしれない。均衡とは、景気後退を追い払う特別な価格や数量の調整が経済に生じないことを意味する点を思い出そう。
The appropriate response to a recessionary gap is for the government to reduce taxes or increase spending so that the aggregate expenditure function shifts up from AE0 to AE1. When this shift occurs, the new equilibrium E1 now occurs at potential GDP as shown in Figure D.9 (a).
英語のヒント
景気後退ギャップへの適切な対応は、政府が減税または支出増加を行い、総支出関数をAE0からAE1へ上方移動させることである。この移動が起これば、図D.9(a)のように、新しい均衡E1は潜在GDPで生じる。
Conversely, Figure D.9 (b) shows a situation where the aggregate expenditure schedule (AE0) intersects the 45-degree line above potential GDP. The gap between the level of real GDP at the equilibrium E0 and potential GDP is called an inflationary gap. The inflationary gap also requires a bit of interpreting. After all, a naïve reading of the Keynesian cross diagram might suggest that if the aggregate expenditure function is just pushed up high enough, real GDP can be as large as desired—even doubling or tripling the potential GDP level of the economy. This implication is clearly wrong. An economy faces some supply-side limits on how much it can produce at a given time with its existing quantities of workers, physical and human capital, technology, and market institutions.
英語のヒント
逆に図D.9(b)は、総支出曲線AE0が潜在GDPより上で45度線と交わる状況を示す。均衡E0での実質GDP水準と潜在GDPの差を、インフレ・ギャップと呼ぶ。インフレ・ギャップにも、少し解釈が必要である。ケインズの交差図を素朴に読めば、総支出関数を十分高く押し上げさえすれば、実質GDPを望むだけ大きく、潜在GDPの2倍や3倍にさえできるように見えるかもしれない。この含意は明らかに誤っている。経済がある時点で生産できる量には、既存の労働者数、物的・人的資本、技術、市場制度による供給側の制限がある。
The inflationary gap should be interpreted, not as a literal prediction of how large real GDP will be, but as a statement of how much extra aggregate expenditure is in the economy beyond what is needed to reach potential GDP. An inflationary gap suggests that because the economy cannot produce enough goods and services to absorb this level of aggregate expenditures, the spending will instead cause an inflationary increase in the price level. In this way, even though changes in the price level do not appear explicitly in the Keynesian cross equation, the notion of inflation is implicit in the concept of the inflationary gap.
英語のヒント
インフレ・ギャップは、実質GDPがどれだけ大きくなるかの文字どおりの予測ではなく、潜在GDPに達するのに必要な額を超えて、経済にどれだけ余分な総支出があるかを示すものと解釈すべきである。インフレ・ギャップは、その総支出水準を吸収するだけの財・サービスを経済が生産できないため、支出が代わりにインフレによる物価上昇を引き起こすことを示唆する。このように、物価水準の変化がケインズの交差方程式に明示的に現れなくても、インフレの考えはインフレ・ギャップの概念に含まれている。
The appropriate Keynesian response to an inflationary gap is shown in Figure D.9 (b). The original intersection of aggregate expenditure line AE0 and the 45-degree line occurs at $8,000, which is above the level of potential GDP at $7,000. If AE0 shifts down to AE1, so that the new equilibrium is at E1, then the economy will be at potential GDP without pressures for inflationary price increases. The government can achieve a downward shift in aggregate expenditure by increasing taxes on consumers or firms, or by reducing government expenditures.
英語のヒント
インフレ・ギャップへの適切なケインズ派の対応を図D.9(b)に示す。当初の総支出線AE0と45度線の交点は8,000ドルにあり、潜在GDPの7,000ドルを上回る。AE0がAE1へ下がり、新しい均衡がE1になれば、経済はインフレによる価格上昇圧力なしに潜在GDPに達する。政府は、消費者や企業への増税、または政府支出の削減によって、総支出を下方移動させられる。