付録
Multiplier Tradeoffs: Stability versus the Power of Macroeconomic Policy
英語のヒント
乗数のトレードオフ――安定性とマクロ経済政策の力
Is an economy healthier with a high multiplier or a low one? With a high multiplier, any change in aggregate demand will tend to be substantially magnified, and so the economy will be more unstable. With a low multiplier, by contrast, changes in aggregate demand will not be multiplied much, so the economy will tend to be more stable.
英語のヒント
経済は、乗数が大きい方が健全なのか、小さい方が健全なのか。乗数が大きいと、総需要の変化はどれも大きく増幅される傾向があるため、経済は不安定になる。対照的に、乗数が小さいと総需要の変化はあまり増幅されず、経済はより安定する傾向がある。
However, with a low multiplier, government policy changes in taxes or spending will tend to have less impact on the equilibrium level of real output. With a higher multiplier, government policies to raise or reduce aggregate expenditures will have a larger effect. Thus, a low multiplier means a more stable economy, but also weaker government macroeconomic policy, while a high multiplier means a more volatile economy, but also an economy in which government macroeconomic policy is more powerful.
英語のヒント
しかし乗数が小さいと、税や支出に関する政府の政策変更は、均衡実質産出水準への影響が小さくなる傾向がある。乗数が大きいと、総支出を増減させる政府政策は大きな効果を持つ。したがって、乗数が小さいことは、経済がより安定する一方で政府のマクロ経済政策も弱いことを意味し、乗数が大きいことは、経済の変動が大きい一方で政府のマクロ経済政策も強力であることを意味する。
Key Concepts and Summary重要概念とまとめ
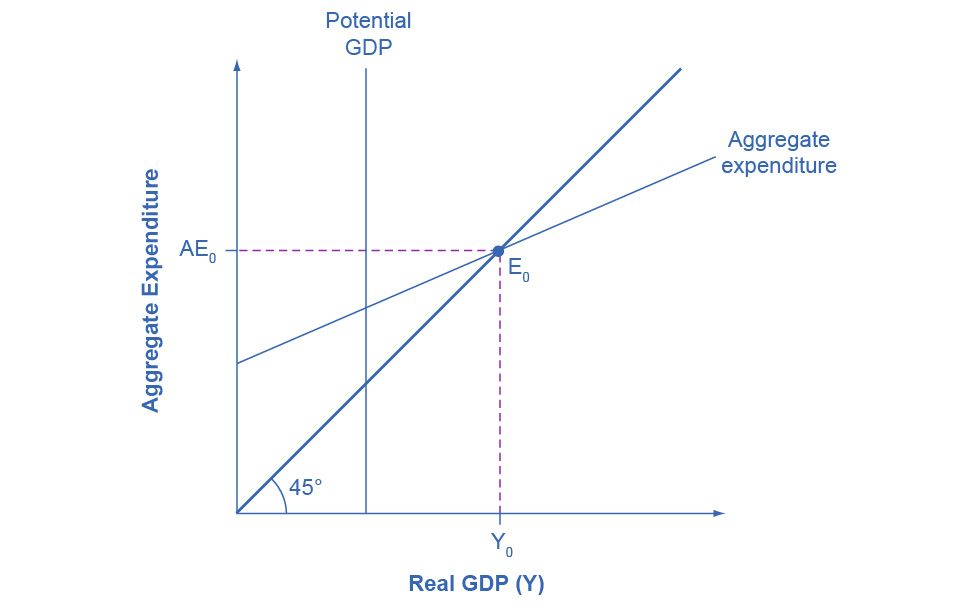
The expenditure-output model or Keynesian cross diagram shows how the level of aggregate expenditure (on the vertical axis) varies with the level of economic output (shown on the horizontal axis). Since the value of all macroeconomic output also represents income to someone somewhere else in the economy, the horizontal axis can also be interpreted as national income. The equilibrium in the diagram will occur where the aggregate expenditure line crosses the 45-degree line, which represents the set of points where aggregate expenditure in the economy is equal to output (or national income). Equilibrium in a Keynesian cross diagram can happen at potential GDP, or below or above that level.
英語のヒント
支出・産出モデル、またはケインズの交差図は、縦軸の総支出水準が、横軸の経済の産出水準とともにどう変わるかを示す。マクロ経済のすべての生産物の価値は、経済のどこかの誰かの所得でもあるため、横軸は国民所得とも解釈できる。図の均衡は、総支出線と45度線の交点で生じる。45度線は、経済の総支出が産出量、または国民所得と等しい点の集合を表す。ケインズの交差図の均衡は、潜在GDP、その下、またはその上で生じうる。
The consumption function shows the upward-sloping relationship between national income and consumption. The marginal propensity to consume (MPC) is the amount consumed out of an additional dollar of income. A higher marginal propensity to consume means a steeper consumption function; a lower marginal propensity to consume means a flatter consumption function. The marginal propensity to save (MPS) is the amount saved out of an additional dollar of income. It is necessarily true that MPC + MPS = 1. The investment function is drawn as a flat line, showing that investment in the current year does not change with regard to the current level of national income. However, the investment function will move up and down based on the expected rate of return in the future. Government spending is drawn as a horizontal line in the Keynesian cross diagram, because its level is determined by political considerations, not by the current level of income in the economy. Taxes in the basic Keynesian cross diagram are taken into account by adjusting the consumption function. The export function is drawn as a horizontal line in the Keynesian cross diagram, because exports do not change as a result of changes in domestic income, but they move as a result of changes in foreign income, as well as changes in exchange rates. The import function is drawn as a downward-sloping line, because imports rise with national income, but imports are a subtraction from aggregate demand. Thus, a higher level of imports means a lower level of expenditure on domestic goods.
英語のヒント
消費関数は、国民所得と消費の右上がりの関係を示す。限界消費性向(MPC)は、追加的な所得1ドルのうち消費される額である。限界消費性向が高いほど消費関数は急になり、低いほど緩やかになる。限界貯蓄性向(MPS)は、追加的な所得1ドルのうち貯蓄される額である。必ずMPC+MPS=1が成立する。投資関数は水平線として描かれ、当年の投資が現在の国民所得水準によって変わらないことを示す。しかし投資関数は、将来の予想収益率に基づいて上下に動く。政府支出は、現在の所得水準ではなく政治的判断で決まるので、ケインズの交差図では水平線として描かれる。基本的なケインズの交差図では、消費関数を調整することで税を考慮する。輸出は国内所得の変化では変わらず、外国所得や為替レートの変化で動くため、輸出関数は水平線として描かれる。輸入は国民所得とともに増えるが総需要から控除するため、輸入関数は右下がりの線となる。したがって輸入が多いほど、国内の財への支出は少なくなる。
In a Keynesian cross diagram, the equilibrium may be at a level below potential GDP, which is called a recessionary gap, or at a level above potential GDP, which is called an inflationary gap.
英語のヒント
ケインズの交差図では、均衡が潜在GDPを下回る水準にある場合を景気後退ギャップ、上回る水準にある場合をインフレ・ギャップと呼ぶ。
The multiplier effect describes how an initial change in aggregate demand generated several times as much as cumulative GDP. The size of the spending multiplier is determined by three leakages: spending on savings, taxes, and imports. The formula for the multiplier is:
英語のヒント
乗数効果は、総需要の当初の変化が、累積GDPにその何倍もの変化を生む仕組みを説明する。支出乗数の大きさは、貯蓄、税、輸入への支出という三つの漏出で決まる。乗数の公式は次のとおりである。
An economy with a lower multiplier is more stable—it is less affected either by economic events or by government policy than an economy with a higher multiplier.
英語のヒント
乗数が小さい経済はより安定しており、乗数が大きい経済よりも、経済上の出来事や政府政策のどちらからも受ける影響が小さい。
Self-Check Questions理解度確認問題
Exercises 1–5練習問題 1–5
Exercise 1問題 1
Sketch the aggregate expenditure-output diagram with the recessionary gap.
英語のヒント
景気後退ギャップのある総支出・産出図を描こう。

Exercise 2問題 2
Sketch the aggregate expenditure-output diagram with an inflationary gap.
英語のヒント
インフレ・ギャップのある総支出・産出図を描こう。
Exercise 3問題 3
An economy has the following characteristics:
英語のヒント
ある経済に次の特徴がある。
Y = National income
英語のヒント
Y=国民所得
Taxes = T = 0.25Y
英語のヒント
税=T=0.25Y
C = Consumption = 400 + 0.85(Y – T)
英語のヒント
C=消費=400+0.85(Y-T)
I = 300
I=300
G = 200
G=200
X = 500
X=500
M = 0.1(Y – T)
M=0.1(Y-T)
Find the equilibrium for this economy. If potential GDP is 3,500, then what change in government spending is needed to achieve this level? Do this problem two ways. First, plug 3,500 into the equations and solve for G. Second, calculate the multiplier and figure it out that way.
英語のヒント
この経済の均衡を求めよう。潜在GDPが3,500なら、その水準の実現には政府支出をどれだけ変える必要があるか。二つの方法で解こう。第一に、方程式に3,500を代入してGについて解く。第二に、乗数を計算して求める。
Solution解き方
First, set up the calculation.
英語のヒント
まず計算を設定する。
Then insert Y for AE and 0.25Y for T.
英語のヒント
次に、AEにYを、Tに0.25Yを代入する。
If full employment is 3,500, then one approach is to plug in 3,500 for Y throughout the equation, but to leave G as a separate variable.
英語のヒント
完全雇用が3,500なら、一つの方法は、方程式全体のYに3,500を代入し、Gを別の変数として残すことである。
A G value of 331.25 is an increase of 131.25 from its original level of 200.
英語のヒント
Gの値331.25は、当初の200から131.25の増加である。
Alternatively, the multiplier is that, out of every dollar spent, 0.25 goes to taxes, leaving 0.75, and out of after-tax income, 0.15 goes to savings and 0.1 to imports. Because (0.75)(0.15) = 0.1125 and (0.75)(0.1) = 0.075, this means that out of every dollar spent: 1 –0.25 –0.1125 –0.075 = 0.5625.
英語のヒント
別の方法では、乗数について、支出1ドルのうち0.25が税に回り0.75が残り、税引後所得の0.15が貯蓄、0.1が輸入に回る。(0.75)(0.15)=0.1125、(0.75)(0.1)=0.075なので、支出1ドルのうち、1-0.25-0.1125-0.075=0.5625となる。
Thus, using the formula, the multiplier is:
英語のヒント
したがって、公式を使うと乗数は次のようになる。
To increase equilibrium GDP by 300, it will take a boost of 300/2.2837, which again works out to 131.25.
英語のヒント
均衡GDPを300増やすには、300/2.2837の増加が必要となり、ここでも131.25となる。
Exercise 4問題 4
Table D.7 represents the data behind a Keynesian cross diagram. Assume that the tax rate is 0.4 of national income; the MPC out of the after-tax income is 0.8; investment is $2,000; government spending is $1,000; exports are $2,000 and imports are 0.05 of after-tax income. What is the equilibrium level of output for this economy?
英語のヒント
表D.7は、ケインズの交差図の基礎となるデータを示す。税率を国民所得の0.4、税引後所得に対するMPCを0.8とし、投資を2,000ドル、政府支出を1,000ドル、輸出を2,000ドル、輸入を税引後所得の0.05とする。この経済の均衡産出水準はいくらか。
National Income 国民所得 |
After-tax Income 税引後所得 |
Consumption 消費 |
I + G + X I+G+X |
Minus Imports 輸入を差し引く |
Aggregate Expenditures 総支出 |
|---|---|---|---|---|---|
$8,000 |
$4,340 |
||||
$9,000 |
|||||
$10,000 |
|||||
$11,000 |
|||||
$12,000 |
|||||
$13,000 |
Solution解き方
The following table illustrates the completed table. The equilibrium is level is italicized.
英語のヒント
次の表が、完成した表を示す。均衡水準は斜体で示している。
National Income 国民所得 |
After-tax Income 税引後所得 |
Consumption 消費 |
I + G + X I+G+X |
Minus Imports 輸入を差し引く |
Aggregate Expenditures 総支出 |
|---|---|---|---|---|---|
$8,000 |
$4,800 |
$4,340 |
$5,000 |
$240 |
$9,100 |
$9,000 |
$5,400 |
$4,820 |
$5,000 |
$270 |
$9,550 |
$10,000 |
$6,000 |
$5,300 |
$5,000 |
$300 |
$10,000 |
$11,000 |
$6,600 |
$5,780 |
$5,000 |
$330 |
$10,450 |
$12,000 |
$7,200 |
$6,260 |
$5,000 |
$360 |
$10,900 |
$13,000 |
$7,800 |
$6,240 |
$5,000 |
$4,390 |
$11,350 |
The alternative way of determining equilibrium is to solve for Y, where Y = national income, using: Y = AE = C + I + G + X – M
英語のヒント
均衡を求める別の方法は、Yを国民所得とし、Y=AE=C+I+G+X-Mを用いてYについて解くことである。
Solving for Y, we see that the equilibrium level of output is Y = $10,000.
英語のヒント
Yについて解くと、均衡産出水準はY=10,000ドルだとわかる。
Exercise 5問題 5
Explain how the multiplier works. Use an MPC of 80% in an example.
英語のヒント
乗数がどう働くかを説明しよう。例ではMPCを80%とする。
Solution解き方
The multiplier refers to how many times a dollar will turnover in the economy. It is based on the Marginal Propensity to Consume (MPC) which tells how much of every dollar received will be spent. If the MPC is 80% then this means that out of every one dollar received by a consumer, $0.80 will be spent. This $0.80 is received by another person. In turn, 80% of the $0.80 received, or $0.64, will be spent, and so on. The impact of the multiplier is diluted when the effect of taxes and expenditure on imports is considered. To derive the multiplier, take the 1/1 – F; where F is equal to percent of savings, taxes, and expenditures on imports.
英語のヒント
乗数は、1ドルが経済の中で何回循環するかを指す。受け取る1ドルごとにどれだけ支出されるかを示す限界消費性向(MPC)に基づく。MPCが80%なら、消費者が受け取る1ドルのうち0.80ドルを支出する。この0.80ドルは別の人が受け取る。次に、受け取った0.80ドルの80%、すなわち0.64ドルが支出され、同様に続く。税と輸入への支出の影響を考慮すると、乗数の影響は弱まる。乗数を求めるには1/1-Fを取り、Fは貯蓄、税、輸入支出の割合に等しい。