第15章貧困と経済的不平等
15.2 The Poverty Trap15.2 貧困の罠
Learning Objectives学習目標
Learning Objectives学習目標
By the end of this section, you will be able to:
英語のヒント
この節を学ぶと、次のことができるようになる。
- Explain the poverty trap, noting how government programs impact it
英語のヒント
政府事業の影響に注意しながら、貧困の罠を説明する。 - Identify potential issues in government programs that seek to reduce poverty
英語のヒント
貧困を減らそうとする政府事業の潜在的な問題を特定する。 - Calculate a budget constraint line that represents the poverty trap
英語のヒント
貧困の罠を表す予算制約線を計算する。
Can you give people too much help, or the wrong kind of help? When people are provided with food, shelter, healthcare, income, and other necessities, assistance may reduce their incentive to work, particularly if their work is likely to offer low wages and reduce government assistance. Consider a program to fight poverty that works in this reasonable-sounding manner: the government provides assistance to the those who need it, but as the recipients earn income to support themselves, the government reduces the level of assistance it provides. With such a program, every time a person earns $100, they lose $100 in government support. As a result, the person experiences no net gain for working. Economists call this problem the poverty trap.
英語のヒント
人々を助けすぎたり、間違った種類の助けを与えたりすることはあるだろうか。食料、住居、医療、所得、その他の必需品が与えられると、援助は働く誘因を弱めるかもしれない。とくに、働いても賃金が低く、政府の援助が減る場合にはそうである。一見もっともらしい次の方法で貧困と闘う事業を考えよう。政府は必要な人に援助を与えるが、受給者が自活のために所得を稼ぐと、援助の水準を下げる。この事業では、人が100ドル稼ぐたびに、政府の支援を100ドル失う。その結果、働いても純利益はない。経済学者は、この問題を貧困の罠と呼ぶ。
Consider the situation a single-parent family faces. Figure 15.3 illustrates a single mother (earning $8 an hour) with two children. First, consider the labor-leisure budget constraint that this family faces in a situation without government assistance. On the horizontal axis is hours of leisure (or time spent with family responsibilities) increasing in quantity from left to right. Also on the horizontal axis is the number of hours at paid work, going from zero hours on the right to the maximum of 2,500 hours on the left. On the vertical axis is the amount of income per year rising from low to higher amounts of income. The budget constraint line shows that at zero hours of leisure and 2,500 hours of work, the maximum amount of income is $20,000 ($8 × 2,500 hours). At the other extreme of the budget constraint line, an individual would work zero hours, earn zero income, but enjoy 2,500 hours of leisure. At point A on the budget constraint line, by working 40 hours a week, 50 weeks a year, the utility-maximizing choice is to work a total of 2,000 hours per year and earn $16,000.
英語のヒント
ひとり親世帯が直面する状況を考えよう。図15.3は、子ども2人を持つひとり親の母親(時給8ドル)を示す。まず政府の援助がない状況で、この家族が直面する労働・余暇の予算制約を考える。横軸には、余暇、または家族の責任のために使う時間が、左から右へ増える形で示される。同じ横軸には有給労働の時間数もあり、右の0時間から左の最大2,500時間へ増える。縦軸は年間所得額で、下から上へ増える。予算制約線は、余暇0時間、労働2,500時間で、最大所得が20,000ドル(8ドル×2,500時間)となることを示す。予算制約線の反対の端では、個人は0時間働き、所得も0だが、2,500時間の余暇を楽しむ。予算制約線上の点Aでは、週40時間、年50週間働くことで、効用を最大化する選択は年2,000時間の労働、所得16,000ドルとなる。
Now suppose that a government antipoverty program guarantees every family with a single mother and two children $18,000 in income. This is represented on the graph by a horizontal line at $18,000. With this program, each time the mother earns $1,000, the government will deduct $1,000 of its support. Table 15.3 shows what will happen at each combination of work and government support.
英語のヒント
次に、政府の貧困対策事業が、ひとり親の母親と子ども2人のすべての家族に18,000ドルの所得を保証するとする。これはグラフで、18,000ドルの水平線として表される。この事業では、母親が1,000ドル稼ぐたびに、政府は支援を1,000ドル差し引く。表15.3は、労働と政府支援の各組合せで何が起こるかを示す。
The Poverty Trap in Action貧困の罠の働き
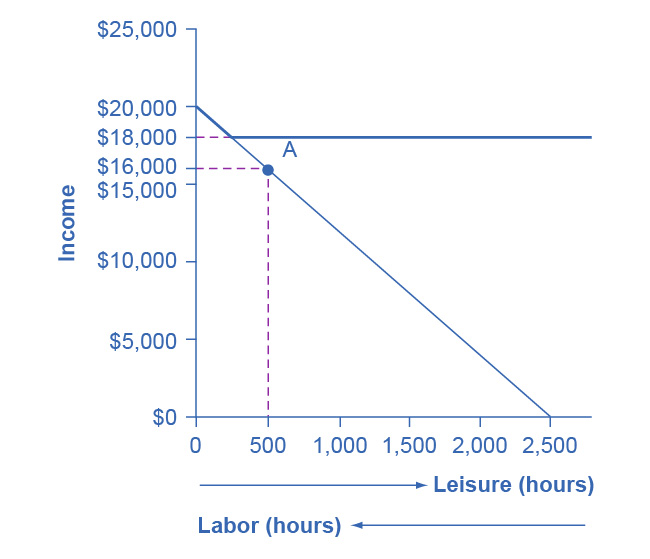
Figure 15.3図 15.3
The original choice is 500 hours of leisure, 2,000 hours of work at point A, and income of $16,000. With a guaranteed income of $18,000, this family would receive $18,000 whether it provides zero hours of work or 2,000 hours of work. Only if the family provides, say, 2,300 hours of work does its income rise above the guaranteed level of $18,000—and even then, the marginal gain to income from working many hours is small.
英語のヒント
当初の選択は、点Aにおける余暇500時間、労働2,000時間、所得16,000ドルである。18,000ドルの所得が保証されると、この家族は、労働を0時間提供しても2,000時間提供しても18,000ドルを受け取る。例えば2,300時間の労働を提供して初めて、所得は保証水準の18,000ドルを上回る。それでも、長時間働くことによる限界的な所得の増加は小さい。
Amount Worked (hours) 労働量(時間) |
Total Earnings 労働所得の合計 |
Government Support 政府の支援 |
Total Income 総所得 |
|---|---|---|---|
0 |
0 |
$18,000 |
$18,000 |
500 |
$4,000 |
$14,000 |
$18,000 |
1,000 |
$8,000 |
$10,000 |
$18,000 |
1,500 |
$12,000 |
$6,000 |
$18,000 |
2,000 |
$16,000 |
$2,000 |
$18,000 |
2,500 |
$20,000 |
0 |
$20,000 |
The new budget line, with the antipoverty program in place, is the horizontal and heavy line that is flat at $18,000. If the mother does not work at all, she receives $18,000, all from the government. If she works full time, giving up 40 hours per week with her children, she still ends up with $18,000 at the end of the year. Only if she works 2,300 hours in the year—which is an average of 44 hours per week for 50 weeks a year—does household income rise to $18,400. Even in this case, all of her year’s work means that household income rises by only $400 over the income she would receive if she did not work at all. She would need to work 50 hours a week to reach $20,800.
英語のヒント
貧困対策事業がある場合の新しい予算線は、18,000ドルの高さにある水平な太線である。母親がまったく働かなければ、全額が政府からの18,000ドルを受け取る。子どもと過ごす週40時間を手放してフルタイムで働いても、年末に得る額はやはり18,000ドルである。年2,300時間、すなわち年50週間、平均週44時間働いて初めて、世帯所得は18,400ドルになる。この場合でさえ、1年を通じて働いた結果は、まったく働かなかった場合より世帯所得が400ドル増えるだけである。20,800ドルに達するには、週50時間働く必要がある。
The poverty trap is even stronger than this simplified example shows, because a working mother will have extra expenses like clothing, transportation, and child care that a nonworking mother will not face, making the economic gains from working even smaller. Moreover, those who do not work fail to build up job experience and contacts, which makes working in the future even less likely.
英語のヒント
貧困の罠は、この単純化した例が示すよりさらに強い。働く母親には、働かない母親にはない衣服、交通、保育などの追加費用がかかり、働く経済的利益がさらに小さくなるためである。また、働かない人は職務経験と人脈を蓄積できず、将来働く可能性がさらに低くなる。
To reduce the poverty trap the government could design an antipoverty program so that, instead of reducing government payments by $1 for every $1 earned, the government would reduce payments by some smaller amount instead. Imposing requirements for work as a condition of receiving benefits and setting a time limit on benefits can also reduce the harshness of the poverty trap.
英語のヒント
貧困の罠を弱めるため、政府は、1ドル稼ぐごとに政府の給付を1ドル減らす代わりに、それより少ない額だけ減らすよう、貧困対策事業を設計できる。給付の条件として就労を義務づけ、給付期間に上限を設けることも、貧困の罠の厳しさを和らげうる。
Figure 15.4 illustrates a government program that guarantees $18,000 in income, even for those who do not work at all, but then reduces this amount by 50 cents for each $1 earned. The new, higher budget line in Figure 15.4 shows that, with this program, additional hours of work will bring some economic gain. Because of the reduction in government income when an individual works, an individual earning $8.00 will really net only $4.00 per hour. The vertical intercept of this higher budget constraint line is at $28,000 ($18,000 + 2,500 hours × $4.00 = $28,000). The horizontal intercept is at the point on the graph where $18,000 and 2500 hours of leisure is set. Table 15.4 shows the total income differences with various choices of labor and leisure.
英語のヒント
図15.4は、まったく働かない人にも18,000ドルの所得を保証するが、1ドル稼ぐごとに、その額を50セント減らす政府事業を示す。図15.4の新しい高い予算線は、この事業では追加の労働時間がいくらかの経済的利益をもたらすことを示す。働くと政府からの所得が減るため、時給8.00ドルを稼ぐ人の実際の純増は1時間4.00ドルだけとなる。この高い予算制約線の縦軸切片は28,000ドル(18,000ドル+2,500時間×4.00ドル=28,000ドル)にある。横軸切片は、グラフ上の18,000ドルと余暇2,500時間が設定される点にある。表15.4は、労働と余暇のさまざまな選択による総所得の違いを示す。
However, this type of program raises other issues. First, even if it does not eliminate the incentive to work by reducing government payments by $1 for every $1 earned, enacting such a program may still reduce the incentive to work. At least some people who would be working 2,000 hours each year without this program might decide to work fewer hours but still end up with more income—that is, their choice on the new budget line would be like S, above and to the right of the original choice P. Of course, others may choose a point like R, which involves the same amount of work as P, or even a point to the left of R that involves more work.
英語のヒント
しかし、この種の事業は別の問題を生む。第1に、1ドル稼ぐごとに政府給付を1ドル減らして働く誘因をなくすわけではなくても、この事業の実施は、なお働く誘因を弱めうる。この事業がなければ年2,000時間働く人の少なくとも一部は、労働時間を減らしながら、それでも多い所得を得ることを選ぶかもしれない。すなわち、新しい予算線上の選択は、当初の選択Pより右上にあるSのようになる。もちろん、Pと同じ労働量を伴うRのような点や、Rより左の、さらに多い労働を伴う点を選ぶ人もいるだろう。
The second major issue is that when the government phases out its support payments more slowly, the antipoverty program costs more money. Still, it may be preferable in the long run to spend more money on a program that retains a greater incentive to work, rather than spending less money on a program that nearly eliminates any gains from working.
英語のヒント
第2の大きな問題は、政府が支援給付をより緩やかに縮小すると、貧困対策事業の費用が増えることである。それでも長期的には、働く利益をほぼなくす事業に少ない金額を使うより、働く誘因をより大きく保つ事業に多くの金額を使うほうが望ましいかもしれない。
Loosening the Poverty Trap: Reducing Government Assistance by 50 Cents for Every $1 Earned貧困の罠を緩める:1ドル稼ぐごとに政府援助を50セント減らす
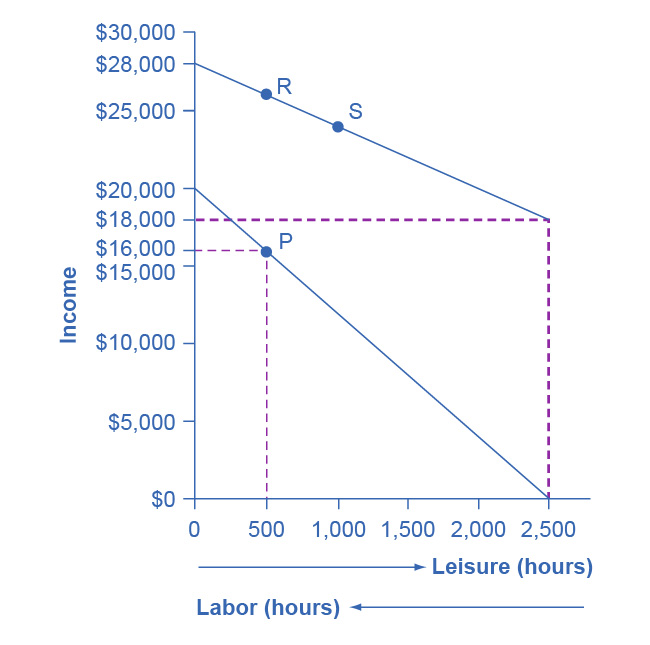


Figure 15.4図 15.4
On the original labor-leisure opportunity set, the lower, downward-sloping budget set, the preferred choice P is 500 hours of leisure and $16,000 of income. Then, the government created an antipoverty program that guarantees $18,000 in income even to those who work zero hours, shown by the hoizontal dashed line. In addition, every $1 earned means phasing out 50 cents of benefits at $18,000. This program leads to the higher budget set, which the diagram shows. The hope is that this program will provide incentives to work the same or more hours, despite receiving income assistance. However, it is possible that the recipients will choose a point on the new budget set like S, with less work, more leisure, and greater income, or a point like R, with the same work and greater income.
英語のヒント
当初の労働・余暇の機会集合である、低い右下がりの予算集合では、望ましい選択Pは余暇500時間、所得16,000ドルである。その後、政府は、0時間しか働かない人にも18,000ドルの所得を保証する貧困対策事業を作った。これが水平の破線で示される。さらに、1ドル稼ぐごとに、18,000ドルの給付を50セントずつ縮小する。この事業により、図に示される高い予算集合が生じる。期待されるのは、所得援助を受けても、同じかより多い時間働く誘因がこの事業によって得られることである。しかし受給者は、新しい予算集合上で、Sのように労働が少なく、余暇と所得が多い点や、Rのように労働は同じで所得が多い点を選ぶ可能性がある。
Amount Worked (hours) 労働量(時間) |
Total Earnings 労働所得の合計 |
Government Support 政府の支援 |
Total Income 総所得 |
|---|---|---|---|
0 |
0 |
$18,000 |
$18,000 |
500 |
$4,000 |
$16,000 |
$20,000 |
1,000 |
$8,000 |
$14,000 |
$22,000 |
1,500 |
$12,000 |
$12,000 |
$24,000 |
2,000 |
$16,000 |
$10,000 |
$26,000 |
2,500 |
$20,000 |
$8,000 |
$28,000 |
The next module will consider a variety of government support programs focused specifically on people experiencing poverty, including welfare, SNAP (Supplemental Nutrition Assistance Program), Medicaid, and the earned income tax credit (EITC). Although these programs vary from state to state, it is generally a true statement that in many states from the 1960s into the 1980s, if poor people worked, their level of income barely rose—or did not rise at all—after factoring in the reduction in government support payments.
英語のヒント
次の節では、福祉給付、SNAP(補助的栄養支援制度)、メディケイド、勤労所得税額控除(EITC)など、とくに貧困を経験する人々を対象とした、さまざまな政府支援事業を考える。これらの事業は州によって異なるが、1960年代から1980年代にかけて多くの州では、貧しい人が働いても、政府の支援給付の減少を考慮すると、所得水準はほとんど上がらないか、まったく上がらなかったというのが、一般に正しい説明である。