第15章貧困と経済的不平等
15.1 Drawing the Poverty Line15.1 貧困線を引く
Learning Objectives学習目標
Learning Objectives学習目標
By the end of this section, you will be able to:
英語のヒント
この節を学ぶと、次のことができるようになる。
- Explain economic inequality and how the poverty line is determined
英語のヒント
経済的不平等と、貧困線の決め方を説明する。 - Analyze the U.S. poverty rate over time, noting its prevalence among different groups of citizens
英語のヒント
さまざまな市民集団での広がりに注意しながら、米国の貧困率の推移を分析する。
Comparisons of high and low incomes raise two different issues: economic inequality and poverty. Poverty is measured by the number of people who fall below a certain level of income—called the poverty line—that defines the income one needs for a basic standard of living. Measures of inequality compare the shares of a nation's income or wealth that comparable groups receive. A common inequality measure is Income inequality. One of numerous ways to look at income inequality is to compare the share of income that the top 10% receive to the share of income that the bottom 10% receive.
英語のヒント
高所得と低所得の比較は、経済的不平等と貧困という2つの異なる問題を提起する。貧困は、基本的な生活水準に必要な所得を定める「貧困線」という、一定の所得水準を下回る人の数で測る。不平等の指標は、比較可能な集団が受け取る国の所得や富の割合を比べる。一般的な不平等の指標の1つは、所得不平等である。所得不平等を見る多くの方法の1つは、上位10%が受け取る所得の割合と、下位10%が受け取る割合を比べることである。
In the United States, the official definition of the poverty line traces back to a single person: Mollie Orshansky. In 1963, Orshansky, who was working for the Social Security Administration, published an article called “Children of the Poor” in a highly useful and dry-as-dust publication called the Social Security Bulletin. Orshansky’s idea was to define a poverty line based on the cost of a healthy diet.
英語のヒント
米国の貧困線の公式定義は、モリー・オーシャンスキーという1人の人物にさかのぼる。社会保障庁で働いていた彼女は、1963年、非常に有用だがひどく無味乾燥な刊行物『社会保障報告』に、「貧しい人々の子ども」という論文を発表した。彼女の考えは、健康的な食事の費用に基づいて貧困線を定めることだった。
Her previous job had been at the U.S. Department of Agriculture, where she had worked in an agency called the Bureau of Home Economics and Human Nutrition. One task of this bureau had been to calculate how much it would cost to feed a nutritionally adequate diet to a family. Orshansky found that the average family spent one-third of its income on food. She then proposed that the poverty line be the amount one requires to buy a nutritionally adequate diet, given the size of the family, multiplied by three.
英語のヒント
彼女の前職は米国農務省で、家政学・人間栄養局という機関で働いていた。この局の仕事の1つは、栄養的に十分な食事を家族に与える費用を計算することだった。オーシャンスキーは、平均的な家族が所得の3分の1を食費に使うと見いだした。そこで、家族の人数を前提に、栄養的に十分な食事を買うのに必要な金額を3倍したものを貧困線にしようと提案した。
The current U.S. poverty line is essentially the same as the Orshansky poverty line, although the government adjusts the dollar amounts to represent the same buying power over time. The U.S. poverty line in 2021 ranged from $12,880 for a single individual to $26,500 for a household of four people.
英語のヒント
現在の米国の貧困線は、基本的にオーシャンスキーの貧困線と同じである。ただし政府は、時がたっても同じ購買力を表すよう、ドル金額を調整する。2021年の米国の貧困線は、単身者の12,880ドルから4人世帯の26,500ドルまでの範囲だった。
Figure 15.2 shows the U.S. poverty rate over time; that is, the percentage of the population below the poverty line in any given year. The poverty rate declined through the 1960s, rose in the early 1980s and early 1990s, but seems to have been slightly lower since the mid-1990s. However, in no year in the last six decades has the poverty rate been less than 10.5% of the U.S. population—that is, at best almost one American in nine is below the poverty line. In recent years, the poverty rate peaked at 15.1% in 2010, before dropping to 10.5% in 2019. Table 15.1 compares poverty rates for different groups in 2011. As you will see when we delve further into these numbers, poverty rates are relatively low for White people, for the elderly, for the well-educated, and for male-headed households. Poverty rates for females, Hispanic people, and African Americans are much higher than for White people. While Hispanic people and African Americans have a higher percentage of individuals living in poverty than others, most people in the United States living below the poverty line are White people.
英語のヒント
図15.2は、米国の貧困率、すなわち各年に貧困線を下回る人口の割合の推移を示す。貧困率は1960年代を通じて低下し、1980年代初めと1990年代初めには上昇したが、1990年代半ば以降はやや低くなったように見える。しかし過去60年間、貧困率が米国人口の10.5%を下回った年は一度もない。つまり、最もよいときでも、ほぼ9人に1人の米国人が貧困線以下にいる。近年では、2010年に15.1%で頂点に達した後、2019年には10.5%へ下がった。表15.1は、2011年のさまざまな集団の貧困率を比べる。数字を詳しく見ると、白人、高齢者、高学歴者、男性が世帯主の世帯では、貧困率が比較的低いとわかる。女性、ヒスパニック、アフリカ系米国人の貧困率は、白人よりはるかに高い。ヒスパニックとアフリカ系米国人では、ほかの人々より貧困状態にある個人の割合が高いが、米国で貧困線以下に暮らす人々の大半は白人である。
Additional Resources追加教材
The U.S. Poverty Rate米国の貧困率
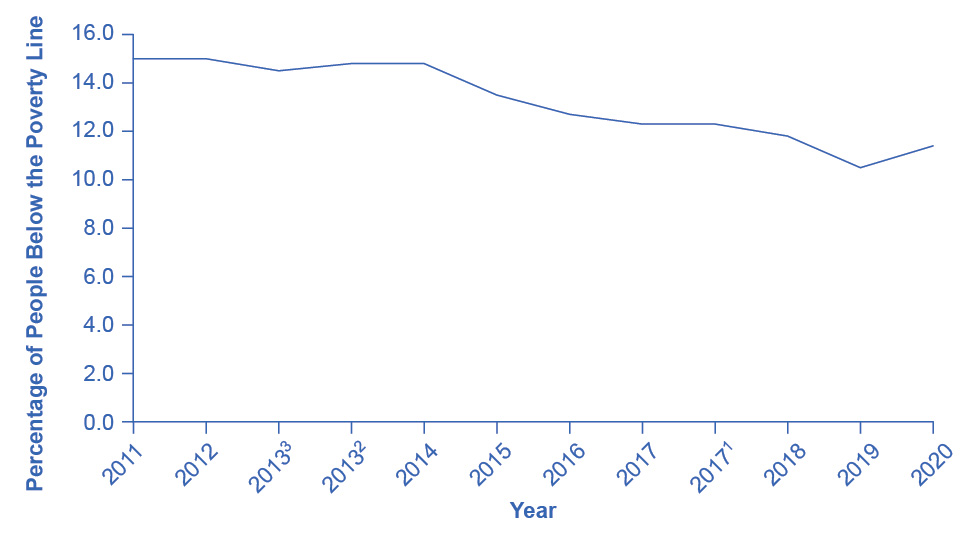

Figure 15.2図 15.2
Between 2010 and 2019, the poverty rate declined to 10.5%, before rising to 11.4% in 2020 due to the onset of the COVID-19 pandemic in 2020. (Source: U.S. Census Bureau)
英語のヒント
貧困率は2010~2019年に10.5%へ低下した後、2020年の新型コロナウイルス感染症の世界的流行の発生により、同年には11.4%へ上昇した。(出典:米国国勢調査局)
Group 集団 |
Poverty Rate 貧困率 |
|---|---|
Females 女性 |
12.6% |
Males 男性 |
10.2% |
White (Non-Hispanic) 白人(非ヒスパニック) |
8.2% |
Black 黒人 |
19.5% |
Hispanic ヒスパニック |
17.0% |
Under age 18 18歳未満 |
16.1% |
Ages 18–64 18~64歳 |
10.4% |
Ages 65+ 65歳以上 |
9.0% |
The concept of a poverty line raises many tricky questions. In a vast country like the United States, should there be a national poverty line? After all, according to the Federal Register, the median household income for a family of four was $109,113 in New Jersey and $59,701 in Mississippi in 2017, and prices of some basic goods like housing are quite different between states. The poverty line is based on cash income, which means it does not account for government programs that provide non-cash assistance such as Medicaid (health care for low-income individuals and families) and food aid. Also, low-income families can qualify for federal housing assistance. (We will discuss these and other government aid programs in detail later in this chapter.)
英語のヒント
貧困線という概念は、多くの難しい問いを提起する。米国のような広大な国で、全国共通の貧困線を設けるべきだろうか。結局、『連邦官報』によれば、2017年の4人家族の世帯所得の中央値は、ニュージャージー州で109,113ドル、ミシシッピ州で59,701ドルであり、住居のような一部の基本的な財の価格は州によって大きく違う。貧困線は現金所得に基づくため、メディケイド(低所得の個人と家族への医療)や食料援助のような現物援助を行う政府事業を考慮しない。また、低所得世帯は連邦の住宅援助を受ける資格を持ちうる。(これらと、ほかの政府援助事業は、この章の後半で詳しく論じる。)
Should the government adjust the poverty line to account for the value of such programs? Many economists and policymakers wonder whether we should rethink the concept of what poverty means in the twenty-first century. The following Clear It Up feature explains the poverty lines set by the World Bank for low-income countries around the world.
英語のヒント
政府は、そのような事業の価値を考慮して貧困線を調整すべきだろうか。多くの経済学者や政策担当者は、21世紀における貧困の意味を考え直すべきかどうかを検討している。次の「疑問を解こう」は、世界銀行が世界の低所得国について設定する貧困線を説明する。
Any poverty line will be somewhat arbitrary, and it is useful to have a poverty line whose basic definition does not change much over time. If Congress voted every few years to redefine poverty, then it would be difficult to compare rates over time. After all, would a lower poverty rate change the definition, or is it the case that people were actually better off? Government statisticians at the U.S. Census Bureau have ongoing research programs to address questions like these.
英語のヒント
どんな貧困線にもある程度の恣意性があり、基本的な定義が時とともにあまり変わらない貧困線を持つことは有用である。議会が数年ごとに投票で貧困を定義し直せば、時系列で貧困率を比較するのは難しい。結局、貧困率が低くなると定義が変わるのか、それとも人々の暮らしが実際によくなったのだろうか。米国国勢調査局の政府統計家は、このような問いに取り組む研究事業を継続している。