第15章貧困と経済的不平等
Lorenz Curveローレンツ曲線
We can present the data on income inequality in various ways. For example, you could draw a bar graph that showed the share of income going to each fifth of the income distribution. Figure 15.8 presents an alternative way of showing inequality data in a Lorenz curve. This curve shows the cumulative share of population on the horizontal axis and the cumulative percentage of total income received on the vertical axis.
英語のヒント
所得不平等のデータは、さまざまな方法で示せる。例えば、所得分布の各5分の1が受け取る割合を示す棒グラフを描ける。図15.8は、ローレンツ曲線で不平等のデータを示す別の方法である。この曲線は、横軸に人口の累積割合、縦軸に受け取った総所得の累積百分率を示す。
The Lorenz Curveローレンツ曲線
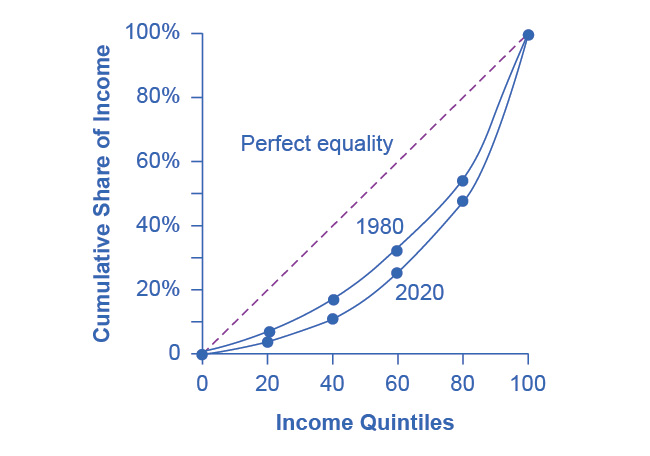

Figure 15.8図 15.8
A Lorenz curve graphs the cumulative shares of income received by everyone up to a certain quintile. The income distribution in 1980 was closer to the perfect equality line than the income distribution in 2020—that is, the U.S. income distribution became more unequal over time.
英語のヒント
ローレンツ曲線は、ある五分位までの全員が受け取る所得の累積割合を描く。1980年の所得分配は、2020年より完全平等線に近かった。つまり、米国の所得分配は時間とともに不平等になった。
Every Lorenz curve diagram begins with a line sloping up at a 45-degree angle. We show it as a dashed line in Figure 15.8. The points along this line show what perfect equality of the income distribution looks like. It would mean, for example, that the bottom 20% of the income distribution receives 20% of the total income, the bottom 40% gets 40% of total income, and so on. The other lines reflect actual U.S. data on inequality for 1980 and 2020.
英語のヒント
どのローレンツ曲線の図も、45度の角度で上がる線から始まる。図15.8では破線で示す。この線上の点は、所得分配が完全に平等な場合を表す。例えば、所得分布の下位20%が総所得の20%、下位40%が総所得の40%を受け取る、という意味である。ほかの線は、1980年と2020年の米国の実際の不平等のデータを反映する。
The trick in graphing a Lorenz curve is that you must change the shares of income for each specific quintile, which we show in the first and third columns of numbers in Table 15.6, into cumulative income, which we show in the second and fourth columns of numbers. For example, the bottom 40% of the cumulative income distribution will be the sum of the first and second quintiles; the bottom 60% of the cumulative income distribution will be the sum of the first, second, and third quintiles, and so on. The final entry in the cumulative income column needs to be 100%, because by definition, 100% of the population receives 100% of the income.
英語のヒント
ローレンツ曲線を描く際の要点は、表15.6の数値の第1列と第3列にある各五分位の所得割合を、第2列と第4列にある累積所得へ変えなければならないことである。例えば、累積所得分布の下位40%は、第1・第2五分位の合計、下位60%は、第1・第2・第3五分位の合計、というようになる。定義により人口の100%が所得の100%を受け取るため、累積所得の列の最後の値は100%でなければならない。
Income Category 所得区分 |
Share of Income in 1980 (%) 1980年の所得割合(%) |
Cumulative Share of Income in 1980 (%) 1980年の所得の累積割合(%) |
Share of Income in 2020 (%) 2020年の所得割合(%) |
Cumulative Share of Income in 2020 (%) 2020年の所得の累積割合(%) |
|---|---|---|---|---|
First quintile 第1五分位 |
4.2 |
4.2 |
3.0 |
3.0 |
Second quintile 第2五分位 |
10.2 |
14.4 |
8.1 |
11.1 |
Third quintile 第3五分位 |
16.8 |
31.2 |
14.0 |
25.1 |
Fourth quintile 第4五分位 |
24.7 |
55.9 |
22.6 |
47.7 |
Fifth quintile 第5五分位 |
44.1 |
100.0 |
52.2 |
100.0 |
In a Lorenz curve diagram, a more unequal distribution of income will loop farther down and away from the 45-degree line, while a more equal distribution of income will move the line closer to the 45-degree line. Figure 15.8 illustrates the greater inequality of the U.S. income distribution between 1980 and 2020 because the Lorenz curve for 2020 is farther from the 45-degree line than the Lorenz curve for 1980. The Lorenz curve is a useful way of presenting the quintile data that provides an image of all the quintile data at once. The next Clear It Up feature shows how income inequality differs in various countries compared to the United States.
英語のヒント
ローレンツ曲線の図では、より不平等な所得分配は、45度線からさらに下へ離れるように曲がり、より平等な所得分配は、45度線に近づく。図15.8では、2020年の曲線が1980年の曲線より45度線から遠いため、1980~2020年に米国の所得分配が不平等になったことが示される。ローレンツ曲線は、五分位の全データを一度に図示する有用な方法である。次の「疑問を解こう」は、米国と比べて、さまざまな国の所得不平等がどう異なるかを示す。