第15章貧困と経済的不平等
Key Concepts and Summary重要概念とまとめ
Measuring inequality involves making comparisons across the entire distribution of income. One way of doing this is to divide the population into groups, like quintiles, and then calculate what share of income each group receives. An alternative approach is to draw Lorenz curves, which compare the cumulative income actually received to a perfectly equal distribution of income. Income inequality in the United States increased substantially from the late 1970s and early 1980s into the 2000s. The two most common explanations that economists cite are changes in household structures that have led to more two-earner couples and single-parent families, and the effect of new information and communications technology on wages.
英語のヒント
不平等の測定は、所得分布全体にわたる比較を伴う。方法の1つは、人口を五分位などの集団に分け、各集団が受け取る所得割合を計算することである。別の方法は、実際に受け取る累積所得を完全に平等な分配と比べるローレンツ曲線を描くことである。米国の所得不平等は、1970年代末・1980年代初めから2000年代にかけて大きく拡大した。経済学者が最もよく挙げる2つの説明は、共働き夫婦とひとり親世帯の増加をもたらす世帯構造の変化と、新しい情報通信技術が賃金に与えた影響である。
Self-Check Questions理解度確認問題
Exercises 23–26練習問題 23–26
Exercise 23問題 23
A group of 10 people have the following annual incomes: $24,000, $18,000, $50,000, $100,000, $12,000, $36,000, $80,000, $10,000, $24,000, $16,000. Calculate the share of total income that each quintile receives from this income distribution. Do the top and bottom quintiles in this distribution have a greater or larger share of total income than the top and bottom quintiles of the U.S. income distribution?
英語のヒント
10人の集団の年間所得は、24,000ドル、18,000ドル、50,000ドル、100,000ドル、12,000ドル、36,000ドル、80,000ドル、10,000ドル、24,000ドル、16,000ドルである。この所得分布で、各五分位が受け取る総所得の割合を計算しなさい。この分布の最上位・最下位五分位の総所得割合は、米国の所得分布の最上位・最下位五分位より大きいか。
Solution解き方
A useful first step is to rank the households by income, from lowest to highest. Then, since there are 10 households total, the bottom quintile will be the bottom two households, the second quintile will be the third and fourth households, and so on up to the top quintile. The quintiles and percentage of total income for the data provided are shown in the following table. Comparing this distribution to the U.S. income distribution for 2005, the top quintile in the example has a smaller share of total income than in the U.S. distribution and the bottom quintile has a larger share. This pattern usually means that the income distribution in the example is more equal than the U.S. distribution.
英語のヒント
最初の有用な手順は、世帯を所得の低い順に並べることである。世帯は全部で10なので、最下位五分位は下から2世帯、第2五分位は3番目と4番目の世帯となり、最上位まで同様に続く。与えられたデータの五分位と総所得の百分率を、次の表に示す。この分布を2005年の米国の所得分布と比べると、例の最上位五分位の総所得割合は米国より小さく、最下位五分位は大きい。この形は通常、例の所得分布が米国より平等だということを意味する。
Income 所得 |
Quintile 五分位 |
% of Total Income 総所得に占める割合(%) |
|---|---|---|
$10,000 |
Total first quintile income: $22,000 第1五分位の総所得:22,000ドル |
6.0% |
$12,000 |
||
$16,000 |
Total second quintile income: $34,000 第2五分位の総所得:34,000ドル |
9.2% |
$18,000 |
||
$24,000 |
Total third quintile income: $48,000 第3五分位の総所得:48,000ドル |
13.0% |
$24,000 |
||
$36,000 |
Total fourth quintile income: $86,000 第4五分位の総所得:86,000ドル |
23.2% |
$50,000 |
||
$80,000 |
Total top quintile income: $180,000 最上位五分位の総所得:180,000ドル |
48.6% |
$100,000 |
||
$370,000 |
Total Income 総所得 |
Exercise 24問題 24
Table 15.8 shows the share of income going to each quintile of the income distribution for the United Kingdom in 1979 and 1991. Use this data to calculate what the points on a Lorenz curve would be, and sketch the Lorenz curve. How did inequality in the United Kingdom shift over this time period? How can you see the patterns in the quintiles in the Lorenz curves?
英語のヒント
表15.8は、1979年と1991年の英国で、所得分布の各五分位が受け取る所得割合を示す。このデータを使い、ローレンツ曲線上の点を計算して曲線を描きなさい。この期間に英国の不平等はどう変わったか。五分位の傾向を、ローレンツ曲線からどのように読み取れるか。
Share of Income 所得の割合 |
1979 |
1991 |
|---|---|---|
Top quintile 最上位五分位 |
39.7% |
42.9% |
Fourth quintile 第4五分位 |
24.8% |
22.7% |
Middle quintile 中央五分位 |
17.0% |
16.3% |
Second quintile 第2五分位 |
11.5% |
11.5% |
Bottom quintile 最下位五分位 |
7.0% |
6.6% |
Solution解き方
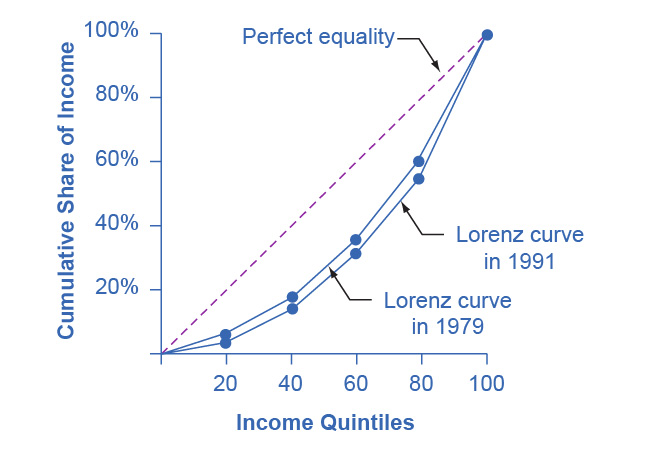
Just from glancing at the quintile information, it is fairly obvious that income inequality increased in the United Kingdom over this time: The top quintile is getting a lot more, and the lowest quintile is getting a bit less. Converting this information into a Lorenz curve, however, is a little trickier, because the Lorenz curve graphs the cumulative distribution, not the amount received by individual quintiles. Thus, as explained in the text, you have to add up the individual quintile data to convert the data to this form. The following table shows the actual calculations for the share of income in 1979 versus 1991. The figure following the table shows the perfect equality line and the Lorenz curves for 1979 and 1991. As shown, the income distribution in 1979 was closer to the perfect equality line than the income distribution in 1991—that is, the United Kingdom income distribution became more unequal over time.
英語のヒント
五分位の情報をざっと見るだけでも、この間に英国の所得不平等が拡大したことはかなり明らかである。最上位五分位は大幅に多く受け取り、最下位五分位は少し減っている。しかし、ローレンツ曲線は各五分位が受け取る額ではなく累積分布を描くため、この情報を曲線へ変換するのは少し難しい。したがって本文で説明したように、各五分位のデータを足して、この形へ変換しなければならない。次の表は、1979年と1991年の所得割合の実際の計算を示す。表の後の図は、完全平等線と両年のローレンツ曲線を示す。図のように、1979年の所得分配は1991年より完全平等線に近かった。つまり、英国の所得分配は時とともに不平等になった。
Share of income received 受け取る所得の割合 |
1979 |
1991 |
|---|---|---|
Bottom 20% 下位20% |
7.0% |
6.6% |
Bottom 40% 下位40% |
18.5% |
18.1% |
Bottom 60% 下位60% |
35.5% |
34.4% |
Bottom 80% 下位80% |
60.3% |
57.1% |
All 100% 全体100% |
100.0% |
100.0% |
Exercise 25問題 25
Using two demand and supply diagrams, one for the low-wage labor market and one for the high-wage labor market, explain how information technology can increase income inequality if it is a complement to high-income workers like salespeople and managers, but a substitute for low-income workers like file clerks and telephone receptionists.
英語のヒント
低賃金労働市場と高賃金労働市場について、2つの需要・供給図を使いなさい。情報技術が、販売員や管理者のような高所得労働者を補完するが、書類係や電話受付係のような低所得労働者を代替する場合、どのように所得不平等を拡大しうるかを説明しなさい。
Solution解き方
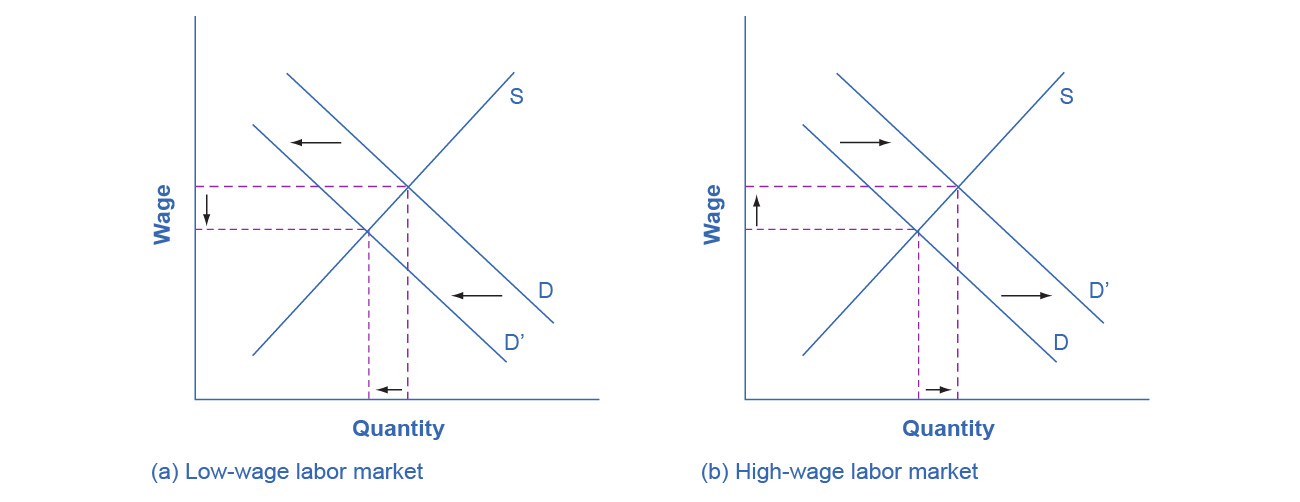
In the market for low-wage labor, information technology shifts the demand for low-wage labor to the left. One reason is that technology can often substitute for low-wage labor in certain kinds of telephone or bookkeeping jobs. In addition, information technology makes it easier for companies to manage connections with low-wage workers in other countries, thus reducing the demand for low-wage workers in the United States. In the market for high-wage labor, information technology shifts the demand for high-wage labor to the right. By using the new information and communications technologies, high-wage labor can become more productive and can oversee more tasks than before. The following figure illustrates these two labor markets. The combination of lower wages for low-wage labor and higher wages for high-wage labor means greater inequality.
英語のヒント
低賃金労働市場では、情報技術は低賃金労働への需要を左へ移す。1つの理由は、ある種の電話や簿記の仕事で、技術が低賃金労働を代替できることが多いためである。また情報技術は、企業が他国の低賃金労働者とのつながりを管理することを容易にし、米国内の低賃金労働者への需要を減らす。高賃金労働市場では、情報技術は高賃金労働への需要を右へ移す。新しい情報通信技術を使うことで、高賃金労働の生産性が高まり、以前より多くの仕事を監督できる。次の図は、この2つの労働市場を示す。低賃金労働の賃金低下と、高賃金労働の賃金上昇の組合せは、不平等の拡大を意味する。
Exercise 26問題 26
Using two demand and supply diagrams, one for the low-wage labor market and one for the high-wage labor market, explain how a program that increased educational levels for a substantial number of low-skill workers could reduce income inequality.
英語のヒント
低賃金労働市場と高賃金労働市場の2つの需要・供給図を使い、多数の低技能労働者の教育水準を高める事業が、どのように所得不平等を減らしうるかを説明しなさい。
Solution解き方
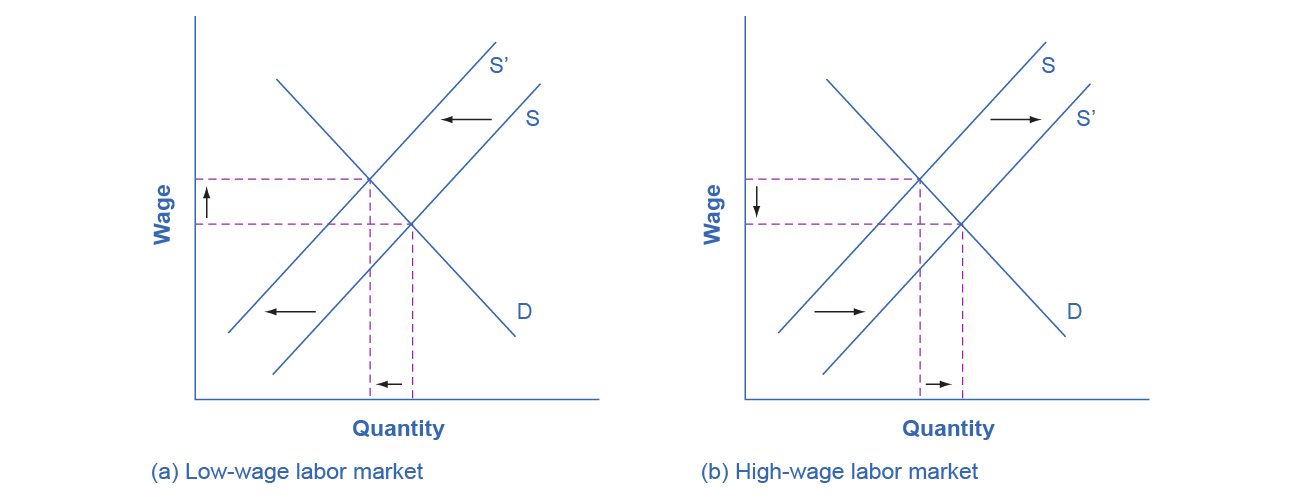
In the market for low-wage labor, a skills program will shift supply to the left, which will tend to drive up wages for the remaining low-skill workers. In the market for high-wage labor, a skills program will shift supply to the right (because after the training program there are now more high-skilled workers at every wage), which will tend to drive down wages for high-skill workers. The combination of these two programs will result in a lesser degree of inequality. The following figure illustrates these two labor markets. In the market for high-wage labor, a skills program will shift supply to the right, which will tend to drive down wages for high-skill workers.
英語のヒント
低賃金労働市場では、技能育成事業は供給を左へ移し、残る低技能労働者の賃金を押し上げる傾向がある。高賃金労働市場では、訓練後はどの賃金でも高技能労働者が増えるため、供給を右へ移し、高技能労働者の賃金を押し下げる傾向がある。この2つの事業の組合せは、不平等を小さくする。次の図は、この2つの労働市場を示す。高賃金労働市場では、技能育成事業が供給を右へ移し、高技能労働者の賃金を押し下げる傾向がある。