第3章需要と供給
3.5 Demand, Supply, and Efficiency3.5 需要・供給と効率性
Learning Objectives学習目標
Learning Objectives学習目標
By the end of this section, you will be able to:
英語のヒント
この節を学ぶと、次のことができるようになる。
- Contrast consumer surplus, producer surplus, and social surplus
英語のヒント
消費者余剰、生産者余剰、社会的余剰を比較する。 - Explain why price floors and price ceilings can be inefficient
英語のヒント
価格下限と価格上限が非効率になりうる理由を説明する。 - Analyze demand and supply as a social adjustment mechanism
英語のヒント
需要と供給を、社会の調整機構として分析する。
The familiar demand and supply diagram holds within it the concept of economic efficiency. One typical way that economists define efficiency is when it is impossible to improve the situation of one party without imposing a cost on another. Conversely, if a situation is inefficient, it becomes possible to benefit at least one party without imposing costs on others.
英語のヒント
おなじみの需要・供給の図には、経済的効率性という概念が含まれている。経済学者による代表的な定義の一つでは、効率的とは、ほかの誰かに費用を負わせずに、ある人の状況を改善することが不可能な状態である。逆に、非効率な状況では、ほかの人に費用を負わせず、少なくとも一人を得させることができる。
Efficiency in the demand and supply model has the same basic meaning: The economy is getting as much benefit as possible from its scarce resources and all the possible gains from trade have been achieved. In other words, the optimal amount of each good and service is produced and consumed.
英語のヒント
需要・供給モデルにおける効率性も、基本的に同じ意味を持つ。希少な資源から得られる便益を最大にし、取引によって得られるすべての利益が実現している状態である。言い換えれば、各財・サービスが最適な量だけ生産・消費されている。
Consumer Surplus, Producer Surplus, Social Surplus消費者余剰・生産者余剰・社会的余剰
Consider a market for tablet computers, as Figure 3.23 shows. The equilibrium price is $80 and the equilibrium quantity is 28 million. To see the benefits to consumers, look at the segment of the demand curve above the equilibrium point and to the left. This portion of the demand curve shows that at least some demanders would have been willing to pay more than $80 for a tablet.
英語のヒント
図3.23のようなタブレット端末の市場を考えよう。均衡価格は80ドル、均衡数量は2,800万台である。消費者の便益を見るには、均衡点の左上にある需要曲線の部分に注目しよう。この部分は、少なくとも一部の需要者が、タブレットに80ドルを超える額を払ってもよかったことを示している。
For example, point J shows that if the price were $90, 20 million tablets would be sold. Those consumers who would have been willing to pay $90 for a tablet based on the utility they expect to receive from it, but who were able to pay the equilibrium price of $80, clearly received a benefit beyond what they had to pay. Remember, the demand curve traces consumers’ willingness to pay for different quantities. The amount that individuals would have been willing to pay, minus the amount that they actually paid, is called consumer surplus. Consumer surplus is the area labeled F—that is, the area above the market price and below the demand curve.
英語のヒント
例えば点Jは、価格90ドルなら2,000万台が売れることを示す。得られると期待する効用に基づき90ドル払ってもよかった消費者が、実際には均衡価格80ドルで買えたなら、支払額を超える便益を得たことは明らかである。需要曲線は、数量ごとの消費者の支払意思額を表していることを思い出そう。個人が払ってもよかった額から、実際の支払額を引いたものを消費者余剰という。図ではFと記した領域、すなわち市場価格より上、需要曲線より下の面積が消費者余剰である。
Consumer and Producer Surplus消費者余剰と生産者余剰
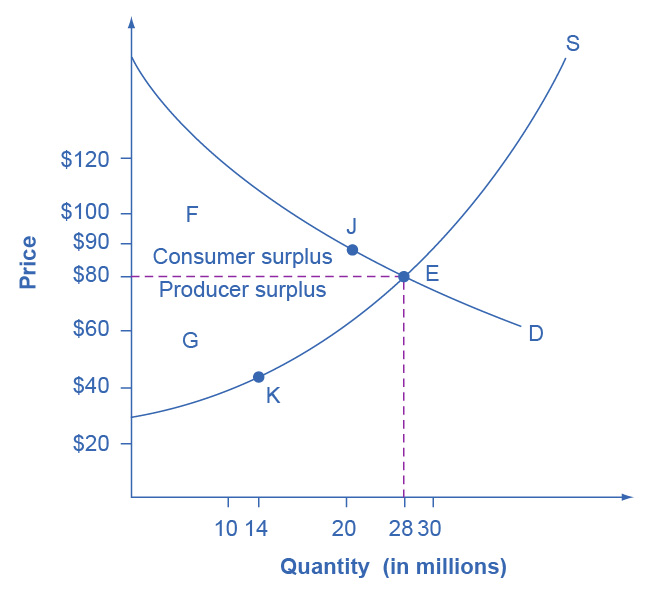

Figure 3.23図 3.23
The somewhat triangular area labeled by F shows the area of consumer surplus, which shows that the equilibrium price in the market was less than what many of the consumers were willing to pay. Point J on the demand curve shows that, even at the price of $90, consumers would have been willing to purchase a quantity of 20 million. The somewhat triangular area labeled by G shows the area of producer surplus, which shows that the equilibrium price received in the market was more than what many of the producers were willing to accept for their products. For example, point K on the supply curve shows that at a price of $45, firms would have been willing to supply a quantity of 14 million.
英語のヒント
おおむね三角形の領域Fが消費者余剰を表す。市場の均衡価格が、多くの消費者の支払意思額より低かったことを示す。需要曲線上の点Jは、価格90ドルでも、消費者が2,000万台を購入する意思を持っていたことを示す。おおむね三角形の領域Gが生産者余剰を表す。市場で受け取った均衡価格が、多くの生産者が受け入れてもよいと考えていた価格を上回ることを示す。例えば、供給曲線上の点Kは、価格45ドルでも企業が1,400万台を供給する意思を持っていたことを示す。
The supply curve shows the quantity that firms are willing to supply at each price. For example, point K in Figure 3.23 illustrates that, at $45, firms would still have been willing to supply a quantity of 14 million. Those producers who would have been willing to supply the tablets at $45, but who were instead able to charge the equilibrium price of $80, clearly received an extra benefit beyond what they required to supply the product. The extra benefit producers receive from selling a good or service, measured by the price the producer actually received minus the price the producer would have been willing to accept is called producer surplus. In Figure 3.23, producer surplus is the area labeled G—that is, the area between the market price and the segment of the supply curve below the equilibrium.
英語のヒント
The sum of consumer surplus and producer surplus is social surplus, also referred to as economic surplus or total surplus. In Figure 3.23 we show social surplus as the area F + G. Social surplus is larger at equilibrium quantity and price than it would be at any other quantity. This demonstrates the economic efficiency of the market equilibrium. In addition, at the efficient level of output, it is impossible to produce greater consumer surplus without reducing producer surplus, and it is impossible to produce greater producer surplus without reducing consumer surplus.
英語のヒント
消費者余剰と生産者余剰の合計が社会的余剰であり、経済的余剰、または総余剰とも呼ばれる。図3.23ではF+Gの面積である。社会的余剰は、均衡数量・均衡価格のときに、ほかのどの数量よりも大きい。これは市場均衡の経済的効率性を示す。さらに、効率的な生産量では、生産者余剰を減らさずに消費者余剰を増やすことも、消費者余剰を減らさずに生産者余剰を増やすこともできない。