第3章需要と供給
Summing Up Factors That Change Demand需要を変える要因のまとめ
Figure 3.9 summarizes six factors that can shift demand curves. The direction of the arrows indicates whether the demand curve shifts represent an increase in demand or a decrease in demand. Notice that a change in the price of the good or service itself is not listed among the factors that can shift a demand curve. A change in the price of a good or service causes a movement along a specific demand curve, and it typically leads to some change in the quantity demanded, but it does not shift the demand curve.
英語のヒント
図3.9は、需要曲線をシフトさせる六つの要因をまとめたものである。矢印の向きは、需要の増加と減少のどちらを表すシフトかを示す。需要曲線をシフトさせる要因に、その財・サービス自体の価格変化は含まれていないことに注意しよう。財・サービス自体の価格変化は、特定の需要曲線に沿った移動を生み、通常は需要量を変えるが、需要曲線そのものはシフトさせない。
Factors That Shift Demand Curves需要曲線をシフトさせる要因
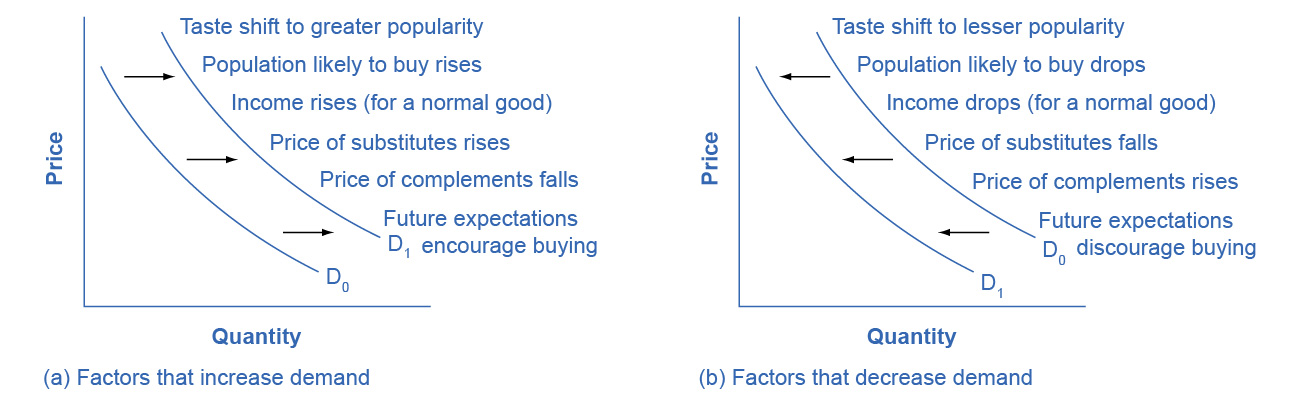
Figure 3.9図 3.9
(a) A list of factors that can cause an increase in demand from D0 to D1. (b) The same factors, if their direction is reversed, can cause a decrease in demand from D0 to D1.
英語のヒント
(a)需要をD0からD1へ増加させうる要因。(b)同じ要因が逆方向に変わると、需要をD0からD1へ減少させうる。
When a demand curve shifts, it will then intersect with a given supply curve at a different equilibrium price and quantity. We are, however, getting ahead of our story. Before discussing how changes in demand can affect equilibrium price and quantity, we first need to discuss shifts in supply curves.
英語のヒント
需要曲線がシフトすると、同じ供給曲線との交点が変わり、均衡価格と均衡数量も変わる。しかし、それは少し先の話である。需要の変化が均衡にどう影響するかを論じる前に、まず供給曲線のシフトを説明する必要がある。
How Production Costs Affect Supply生産費用は供給にどう影響するか
A supply curve shows how quantity supplied will change as the price rises and falls, assuming ceteris paribus so that no other economically relevant factors are changing. If other factors relevant to supply do change, then the entire supply curve will shift. Just as we described a shift in demand as a change in the quantity demanded at every price, a shift in supply means a change in the quantity supplied at every price.
英語のヒント
供給曲線は、セテリス・パリブス、つまり関係するほかの経済的要因が変わらないという仮定の下で、価格の上下に応じて供給量がどう変わるかを示す。供給に関係するほかの要因が変われば、供給曲線全体がシフトする。需要のシフトを各価格での需要量の変化と説明したのと同じく、供給のシフトは、各価格での供給量の変化を意味する。
In thinking about the factors that affect supply, remember what motivates firms: profits, which are the difference between revenues and costs. A firm produces goods and services using combinations of labor, materials, and machinery, or what we call inputs or factors of production. If a firm faces lower costs of production, while the prices for the good or service the firm produces remain unchanged, a firm’s profits go up. When a firm’s profits increase, it is more motivated to produce output, since the more it produces the more profit it will earn. When costs of production fall, a firm will tend to supply a larger quantity at any given price for its output. We can show this by the supply curve shifting to the right.
英語のヒント
供給に影響する要因を考えるときは、企業を動かすものを思い出そう。それは、収入と費用の差である利潤である。企業は、労働、材料、機械を組み合わせて財・サービスを生産する。これらを投入物、あるいは生産要素という。製品の価格が変わらないまま生産費用が下がれば、企業の利潤は増える。利潤が増えると、生産量を増やす意欲が高まる。多く生産するほど多くの利潤を得られるからである。生産費用が下がると、企業はどの販売価格でも供給量を増やす傾向がある。これは供給曲線の右へのシフトで示せる。
Take, for example, a messenger company that delivers packages around a city. The company may find that buying gasoline is one of its main costs. If the price of gasoline falls, then the company will find it can deliver messages more cheaply than before. Since lower costs correspond to higher profits, the messenger company may now supply more of its services at any given price. For example, given the lower gasoline prices, the company can now serve a greater area, and increase its supply.
英語のヒント
例えば、市内で荷物を届ける配送会社を考えよう。ガソリンの購入が主な費用の一つかもしれない。ガソリンが値下がりすると、以前より安く配達できる。費用が低いほど利潤が高くなるので、その会社はどの価格でもサービスの供給量を増やすかもしれない。例えば、ガソリン価格が下がることで、より広い地域を担当し、供給を増やせるようになる。
Conversely, if a firm faces higher costs of production, then it will earn lower profits at any given selling price for its products. As a result, a higher cost of production typically causes a firm to supply a smaller quantity at any given price. In this case, the supply curve shifts to the left.
英語のヒント
逆に、生産費用が上がれば、どの販売価格でも企業の利潤は減る。その結果、生産費用の上昇は通常、各価格での供給量を減らす。この場合、供給曲線は左へシフトする。
Consider the supply for cars, shown by curve S0 in Figure 3.10. Point J indicates that if the price is $20,000, the quantity supplied will be 18 million cars. If the price rises to $22,000 per car, ceteris paribus, the quantity supplied will rise to 20 million cars, as point K on the S0 curve shows. We can show the same information in table form, as in Table 3.5.
英語のヒント
Shifts in Supply: A Car Example供給のシフト――自動車の例
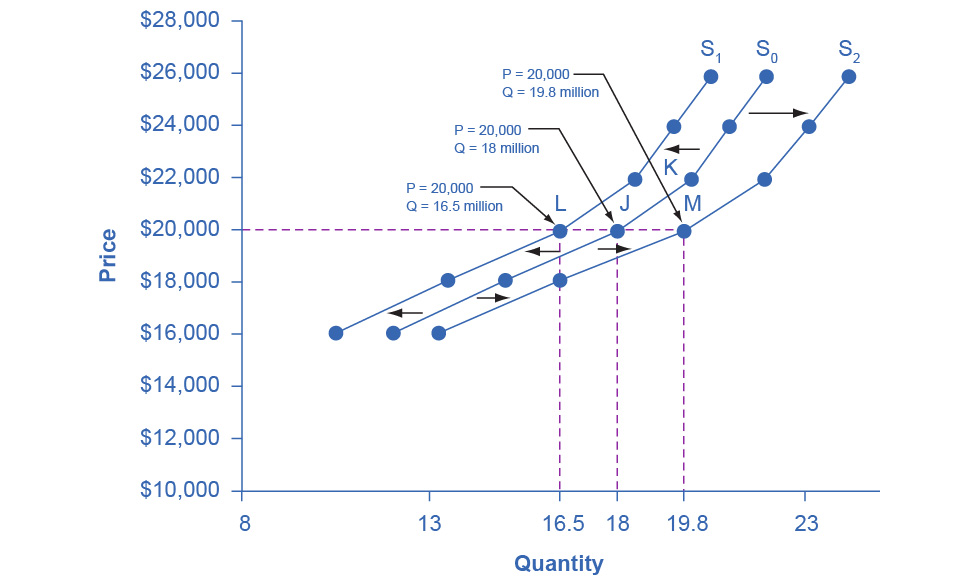


Figure 3.10図 3.10
Decreased supply means that at every given price, the quantity supplied is lower, so that the supply curve shifts to the left, from S0 to S1. Increased supply means that at every given price, the quantity supplied is higher, so that the supply curve shifts to the right, from S0 to S2.
英語のヒント
供給の減少とは、各価格での供給量が減り、供給曲線がS0からS1へ左にシフトすることである。供給の増加とは、各価格での供給量が増え、供給曲線がS0からS2へ右にシフトすることである。
Price 価格 |
Decrease to S1 S1へ減少 |
Original Quantity Supplied S0 元の供給量S0 |
Increase to S2 S2へ増加 |
|---|---|---|---|
$16,000 |
10.5 million 1,050万 |
12.0 million 1,200万 |
13.2 million 1,320万 |
$18,000 |
13.5 million 1,350万 |
15.0 million 1,500万 |
16.5 million 1,650万 |
$20,000 |
16.5 million 1,650万 |
18.0 million 1,800万 |
19.8 million 1,980万 |
$22,000 |
18.5 million 1,850万 |
20.0 million 2,000万 |
22.0 million 2,200万 |
$24,000 |
19.5 million 1,950万 |
21.0 million 2,100万 |
23.1 million 2,310万 |
$26,000 |
20.5 million 2,050万 |
22.0 million 2,200万 |
24.2 million 2,420万 |
Now, imagine that the price of steel, an important ingredient in manufacturing cars, rises, so that producing a car has become more expensive. At any given price for selling cars, car manufacturers will react by supplying a lower quantity. We can show this graphically as a leftward shift of supply, from S0 to S1, which indicates that at any given price, the quantity supplied decreases. In this example, at a price of $20,000, the quantity supplied decreases from 18 million on the original supply curve (S0) to 16.5 million on the supply curve S1, which is labeled as point L.
英語のヒント
ここで、自動車製造の重要な材料である鉄鋼の価格が上がり、生産費用が高くなったとしよう。自動車メーカーは、どの販売価格でも供給量を減らす。これは、S0からS1への供給曲線の左シフトで示せる。どの価格でも供給量が減ることを意味する。この例では、価格20,000ドルでの供給量は、元の供給曲線S0上の1,800万台から、供給曲線S1上の点Lで示す1,650万台へ減る。
Conversely, if the price of steel decreases, producing a car becomes less expensive. At any given price for selling cars, car manufacturers can now expect to earn higher profits, so they will supply a higher quantity. The shift of supply to the right, from S0 to S2, means that at all prices, the quantity supplied has increased. In this example, at a price of $20,000, the quantity supplied increases from 18 million on the original supply curve (S0) to 19.8 million on the supply curve S2, which is labeled M.
英語のヒント
逆に、鉄鋼が値下がりすれば、自動車の生産費用は低くなる。メーカーはどの販売価格でも以前より高い利潤を見込めるので、供給量を増やす。S0からS2への供給曲線の右シフトは、すべての価格で供給量が増えたことを意味する。この例では、価格20,000ドルでの供給量は、元の供給曲線S0上の1,800万台から、供給曲線S2上の点Mで示す1,980万台へ増える。