第3章需要と供給
3.3 Changes in Equilibrium Price and Quantity: The Four-Step Process3.3 均衡価格と均衡数量の変化――四つの手順
Learning Objectives学習目標
Learning Objectives学習目標
By the end of this section, you will be able to:
英語のヒント
この節を学ぶと、次のことができるようになる。
- Identify equilibrium price and quantity through the four-step process
英語のヒント
四つの手順で均衡価格と均衡数量を求める。 - Graph equilibrium price and quantity
英語のヒント
均衡価格と均衡数量をグラフに示す。 - Contrast shifts of demand or supply and movements along a demand or supply curve
英語のヒント
需要・供給のシフトと、曲線に沿った移動を区別する。 - Graph demand and supply curves, including equilibrium price and quantity, based on real-world examples
英語のヒント
現実の例に基づき、均衡価格と均衡数量を含む需要・供給曲線を描く。
Let’s begin this discussion with a single economic event. It might be an event that affects demand, like a change in income, population, tastes, prices of substitutes or complements, or expectations about future prices. It might be an event that affects supply, like a change in natural conditions, input prices, or technology, or government policies that affect production. How does this economic event affect equilibrium price and quantity? We will analyze this question using a four-step process.
英語のヒント
一つの経済的な出来事から考え始めよう。所得、人口、嗜好、代替財・補完財の価格、将来価格の予想の変化など、需要に影響する出来事かもしれない。自然条件、投入物価格、技術、生産に関わる政府政策の変化など、供給に影響する出来事かもしれない。こうした出来事は均衡価格と均衡数量にどう影響するだろうか。四つの手順で分析する。
Step 1. Draw a demand and supply model before the economic change took place. To establish the model requires four standard pieces of information: The law of demand, which tells us the slope of the demand curve is negative; the law of supply, which tells us that the slope of the supply curve is positive; the shift variables for demand; and the shift variables for supply. From this model, find the initial equilibrium values for price and quantity.
英語のヒント
手順1:経済的な変化が起きる前の需要・供給モデルを描く。モデルを作るには、四つの基本情報が必要である。需要曲線の傾きが負であることを示す需要の法則、供給曲線の傾きが正であることを示す供給の法則、需要をシフトさせる変数、供給をシフトさせる変数である。このモデルから、当初の均衡価格と均衡数量を求める。
Step 2. Decide whether the economic change you are analyzing affects demand or supply. In other words, does the event refer to something in the list of demand factors or supply factors?
英語のヒント
手順2:分析する経済的な変化が、需要と供給のどちらに影響するかを決める。言い換えれば、その出来事は需要要因と供給要因のどちらに当てはまるか。
Step 3. Decide whether the effect on demand or supply causes the curve to shift to the right or to the left, and sketch the new demand or supply curve on the diagram. In other words, does the event increase or decrease the amount consumers want to buy or producers want to sell?
英語のヒント
手順3:需要または供給への影響によって、曲線が右と左のどちらへシフトするかを決め、新しい曲線を図に描く。言い換えれば、その出来事は、消費者が買いたい量、あるいは生産者が売りたい量を増やすか、減らすか。
Step 4. Identify the new equilibrium and then compare the original equilibrium price and quantity to the new equilibrium price and quantity.
英語のヒント
手順4:新しい均衡を求め、元の均衡価格・均衡数量と比較する。
Let’s consider one example that involves a shift in supply and one that involves a shift in demand. Then we will consider an example where both supply and demand shift.
英語のヒント
供給がシフトする例と、需要がシフトする例を一つずつ考えよう。その後、両方がシフトする例を考える。
Good Weather for Salmon Fishingサケ漁に適した天候
Suppose that during the summer of 2015, weather conditions were excellent for commercial salmon fishing off the California coast. Heavy rains meant higher than normal levels of water in the rivers, which helps the salmon to breed. Slightly cooler ocean temperatures stimulated the growth of plankton, the microscopic organisms at the bottom of the ocean food chain, providing everything in the ocean with a hearty food supply. The ocean stayed calm during fishing season, so commercial fishing operations did not lose many days to bad weather. How did these climate conditions affect the quantity and price of salmon? Figure 3.16 illustrates the four-step approach, which we explain below, to work through this problem. Table 3.7 also provides the information to work the problem.
英語のヒント
Good Weather for Salmon Fishing: The Four-Step Processサケ漁に適した天候――四つの手順
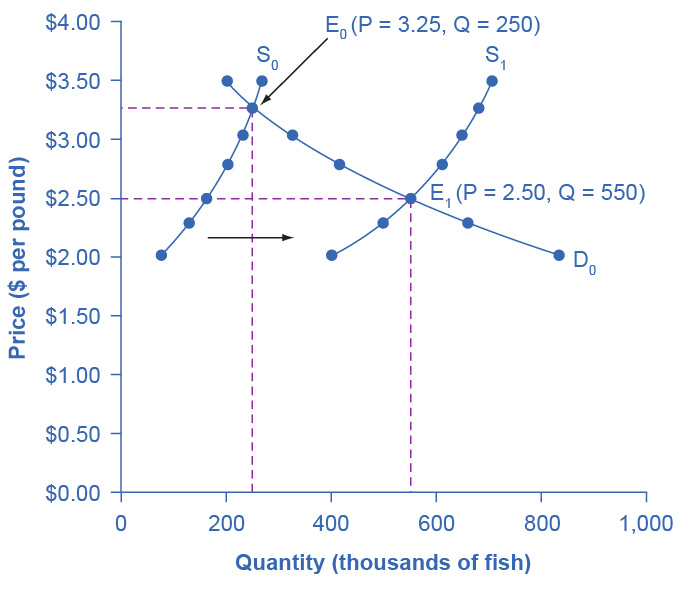

Figure 3.16図 3.16
Unusually good weather leads to changes in the price and quantity of salmon.
英語のヒント
例外的に好適な天候が、サケの価格と数量を変える。
Price per Pound 1ポンド当たりの価格 |
Quantity Supplied in 2014 2014年の供給量 |
Quantity Supplied in 2015 2015年の供給量 |
Quantity Demanded 需要量 |
|---|---|---|---|
$2.00 |
80 |
400 |
840 |
$2.25 |
120 |
480 |
680 |
$2.50 |
160 |
550 |
550 |
$2.75 |
200 |
600 |
450 |
$3.00 |
230 |
640 |
350 |
$3.25 |
250 |
670 |
250 |
$3.50 |
270 |
700 |
200 |
Step 1. Draw a demand and supply model to illustrate the market for salmon in the year before the good weather conditions began. The demand curve D0 and the supply curve S0 show that the original equilibrium price is $3.25 per pound and the original equilibrium quantity is 250,000 fish. (This price per pound is what commercial buyers pay at the fishing docks. What consumers pay at the grocery is higher.)
英語のヒント
手順1:好天候になる前年のサケ市場を、需要・供給モデルで描く。需要曲線D0と供給曲線S0から、元の均衡価格は1ポンド3.25ドル、均衡数量は25万匹とわかる。(この価格は、商業的な買い手が漁港で払う価格である。消費者が食料品店で払う価格は、これより高い。)
Step 2. Did the economic event affect supply or demand? Good weather is an example of a natural condition that affects supply.
英語のヒント
手順2:出来事は需要と供給のどちらに影響したか。好天候は、供給に影響する自然条件の一例である。
Step 3. Was the effect on supply an increase or a decrease? Good weather is a change in natural conditions that increases the quantity supplied at any given price. The supply curve shifts to the right, moving from the original supply curve S0 to the new supply curve S1, which Figure 3.16 and Table 3.7 show.
英語のヒント
Step 4. Compare the new equilibrium price and quantity to the original equilibrium. At the new equilibrium E1, the equilibrium price falls from $3.25 to $2.50, but the equilibrium quantity increases from 250,000 to 550,000 salmon. Notice that the equilibrium quantity demanded increased, even though the demand curve did not move.
英語のヒント
手順4:新しい均衡価格と均衡数量を、元の均衡と比べる。新しい均衡E1では、価格は3.25ドルから2.50ドルへ下がるが、数量は25万匹から55万匹へ増える。需要曲線は動いていないのに、均衡での需要量が増えたことに注意しよう。
In short, good weather conditions increased supply of the California commercial salmon. The result was a higher equilibrium quantity of salmon bought and sold in the market at a lower price.
英語のヒント
つまり、好天候がカリフォルニアの商業漁業によるサケの供給を増やした。その結果、市場では以前より低い価格で、より多くのサケが売買される均衡になった。