第3章需要と供給
Summing Up Factors That Change Supply供給を変える要因のまとめ
Changes in the cost of inputs, natural disasters, new technologies, and the impact of government decisions all affect the cost of production. In turn, these factors affect how much firms are willing to supply at any given price.
英語のヒント
投入物の費用の変化、自然災害、新技術、政府の意思決定の影響は、いずれも生産費用に影響する。それを通じて、各価格で企業が供給しようとする量を変える。
Figure 3.15 summarizes factors that change the supply of goods and services. Notice that a change in the price of the product itself is not among the factors that shift the supply curve. Although a change in price of a good or service typically causes a change in quantity supplied or a movement along the supply curve for that specific good or service, it does not cause the supply curve itself to shift.
英語のヒント
図3.15は、財・サービスの供給を変える要因をまとめている。製品自体の価格変化は、供給曲線をシフトさせる要因には含まれないことに注意しよう。財・サービス自体の価格が変わると、通常はその供給量が変わり、供給曲線に沿った移動が起こる。しかし、供給曲線そのものはシフトしない。
Factors That Shift Supply Curves供給曲線をシフトさせる要因
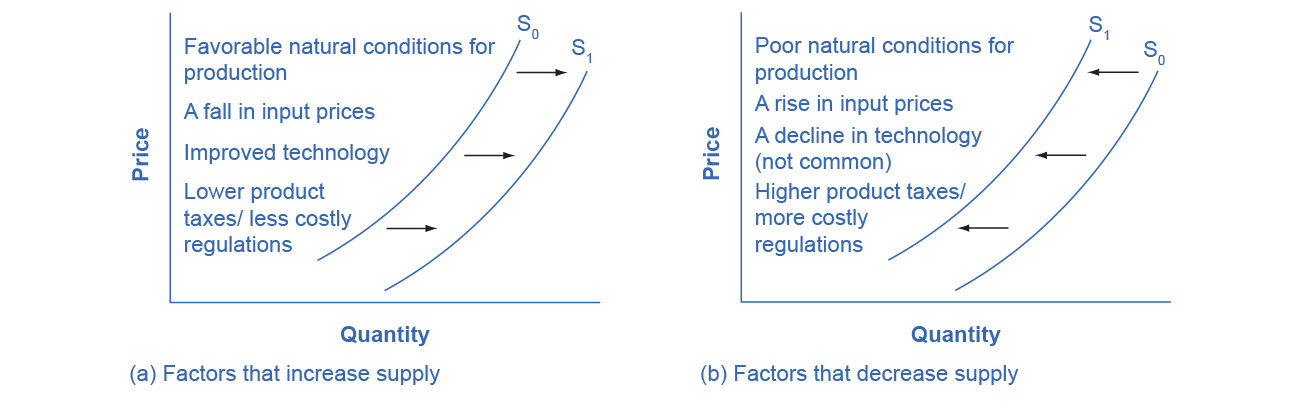

Figure 3.15図 3.15
(a) A list of factors that can cause an increase in supply from S0 to S1. (b) The same factors, if their direction is reversed, can cause a decrease in supply from S0 to S1.
英語のヒント
(a)供給をS0からS1へ増加させうる要因。(b)同じ要因が逆方向に変わると、供給をS0からS1へ減少させうる。
Because demand and supply curves appear on a two-dimensional diagram with only price and quantity on the axes, an unwary visitor to the land of economics might be fooled into believing that economics is about only four topics: demand, supply, price, and quantity. However, demand and supply are really “umbrella” concepts: demand covers all the factors that affect demand, and supply covers all the factors that affect supply. We include factors other than price that affect demand and supply by using shifts in the demand or the supply curve. In this way, the two-dimensional demand and supply model becomes a powerful tool for analyzing a wide range of economic circumstances.
英語のヒント
需要曲線と供給曲線は、価格と数量だけを軸に取る二次元の図に描かれる。そのため、経済学の世界を初めて訪れた人は、うっかりすると、経済学は需要、供給、価格、数量の四つしか扱わないと思い込むかもしれない。しかし、需要と供給は、多くの要因を包み込む概念である。需要はそれに影響するすべての要因を、供給もそれに影響するすべての要因を含む。価格以外の要因は、需要曲線や供給曲線のシフトによって取り入れられる。こうして二次元の需要・供給モデルは、幅広い経済状況を分析する強力な道具になる。
Key Concepts and Summary重要概念とまとめ
Economists often use the ceteris paribus or “other things being equal” assumption: while examining the economic impact of one event, all other factors remain unchanged for analysis purposes. Factors that can shift the demand curve for goods and services, causing a different quantity to be demanded at any given price, include changes in tastes, population, income, prices of substitute or complement goods, and expectations about future conditions and prices. Factors that can shift the supply curve for goods and services, causing a different quantity to be supplied at any given price, include input prices, natural conditions, changes in technology, and government taxes, regulations, or subsidies.
英語のヒント
経済学者はしばしば、セテリス・パリブス、すなわち「ほかの条件が等しい」という仮定を使う。一つの出来事の経済的影響を調べる際、分析のため、ほかのすべての要因を変わらないものとする。各価格での需要量を変え、需要曲線をシフトさせる要因には、嗜好、人口、所得、代替財や補完財の価格、将来の状況や価格についての予想の変化がある。各価格での供給量を変え、供給曲線をシフトさせる要因には、投入物価格、自然条件、技術の変化、政府の税・規制・補助金がある。
Self-Check Questions理解度確認問題
Exercises 16–18練習問題 16–18
Exercise 16問題 16
Why do economists use the ceteris paribus assumption?
英語のヒント
経済学者はなぜ、セテリス・パリブスの仮定を使うのか。
Solution解き方
To make it easier to analyze complex problems. Ceteris paribus allows you to look at the effect of one factor at a time on what it is you are trying to analyze. When you have analyzed all the factors individually, you add the results together to get the final answer.
英語のヒント
複雑な問題を分析しやすくするためである。この仮定によって、分析対象に対する一つの要因の効果を、その都度取り出して見られる。すべての要因を個別に分析した後、結果を合わせて最終的な答えを得る。
Exercise 17問題 17
In an analysis of the market for paint, an economist discovers the facts listed below. State whether each of these changes will affect supply or demand, and in what direction.
英語のヒント
塗料市場の分析で、経済学者が以下の事実を見つけた。それぞれの変化が需要と供給のどちらに、どの方向の影響を与えるかを述べよ。
- There have recently been some important cost-saving inventions in the technology for making paint.
英語のヒント
最近、塗料の製造技術で、費用を削減する重要な発明がいくつかあった。 - Paint is lasting longer, so that property owners need not repaint as often.
英語のヒント
塗料が長持ちするようになり、建物の所有者は以前ほど頻繁に塗り直す必要がなくなった。 - Because of severe hailstorms, many people need to repaint now.
英語のヒント
激しいひょうの嵐によって、多くの人が今、塗り直しを必要としている。 - The hailstorms damaged several factories that make paint, forcing them to close down for several months.
英語のヒント
ひょうの嵐で複数の塗料工場が損傷し、数か月の操業停止を余儀なくされた。
Solution解き方
- An improvement in technology that reduces the cost of production will cause an increase in supply. Alternatively, you can think of this as a reduction in price necessary for firms to supply any quantity. Either way, this can be shown as a rightward (or downward) shift in the supply curve.
英語のヒント
生産費用を下げる技術進歩は、供給を増やす。あるいは、任意の数量を供給するために企業が必要とする価格が下がると考えてもよい。どちらの見方でも、供給曲線の右、または下へのシフトで示せる。 - An improvement in product quality is treated as an increase in tastes or preferences, meaning consumers demand more paint at any price level, so demand increases or shifts to the right. If this seems counterintuitive, note that demand in the future for the longer-lasting paint will fall, since consumers are essentially shifting demand from the future to the present.
英語のヒント
製品の品質向上は、嗜好や選好の高まりとして扱う。消費者は各価格でより多くの塗料を需要するので、需要は増え、右へシフトする。直感に反するように思えるなら、長持ちする塗料への将来の需要は減ることに注意しよう。消費者は実質的に、需要を将来から現在へ移しているのである。 - An increase in need causes an increase in demand or a rightward shift in the demand curve.
英語のヒント
必要性が高まると需要が増え、需要曲線は右へシフトする。 - Factory damage means that firms are unable to supply as much in the present. Technically, this is an increase in the cost of production. Either way you look at it, the supply curve shifts to the left.
英語のヒント
工場の損傷により、企業は現在、以前と同じ量を供給できない。厳密には、これは生産費用の増加である。どちらの見方でも、供給曲線は左へシフトする。
Exercise 18問題 18
Many changes are affecting the market for oil. Predict how each of the following events will affect the equilibrium price and quantity in the market for oil. In each case, state how the event will affect the supply and demand diagram. Create a sketch of the diagram if necessary.
英語のヒント
石油市場には多くの変化が影響している。次の各出来事が、石油市場の均衡価格と均衡数量にどう影響するかを予測せよ。それぞれ、需要・供給の図がどう変化するか述べよ。必要なら図を描け。
- Cars are becoming more fuel efficient, and therefore get more miles to the gallon.
英語のヒント
自動車の燃費が改善し、1ガロンで走れる距離が長くなっている。 - The winter is exceptionally cold.
英語のヒント
冬が例外的に寒い。 - A major discovery of new oil is made off the coast of Norway.
英語のヒント
ノルウェー沖で、大規模な新しい油田が発見される。 - The economies of some major oil-using nations, like Japan, slow down.
英語のヒント
日本など、石油を多く使う主要国の一部で景気が減速する。 - A war in the Middle East disrupts oil-pumping schedules.
英語のヒント
中東の戦争が、石油採掘の予定を狂わせる。 - Landlords install additional insulation in buildings.
英語のヒント
家主が建物に断熱材を追加する。 - The price of solar energy falls dramatically.
英語のヒント
太陽エネルギーの価格が大幅に下がる。 - Chemical companies invent a new, popular kind of plastic made from oil.
英語のヒント
化学会社が、石油から作る人気の高い新種のプラスチックを発明する。
Solution解き方
- More fuel-efficient cars means there is less need for gasoline. This causes a leftward shift in the demand for gasoline and thus oil. Since the demand curve is shifting down the supply curve, the equilibrium price and quantity both fall.
英語のヒント
燃費のよい自動車はガソリンの必要量を減らす。ガソリン、したがって石油の需要が左へシフトする。需要曲線の移動によって均衡点が供給曲線に沿って下がるため、均衡価格と均衡数量はどちらも低下する。 - Cold weather increases the need for heating oil. This causes a rightward shift in the demand for heating oil and thus oil. Since the demand curve is shifting up the supply curve, the equilibrium price and quantity both rise.
英語のヒント
寒さは暖房用油の必要量を増やす。暖房用油、したがって石油の需要が右へシフトする。需要曲線の移動によって均衡点が供給曲線に沿って上がるため、均衡価格と均衡数量はどちらも上昇する。 - A discovery of new oil will make oil more abundant. This can be shown as a rightward shift in the supply curve, which will cause a decrease in the equilibrium price along with an increase in the equilibrium quantity. (The supply curve shifts down the demand curve so price and quantity follow the law of demand. If price goes down, then the quantity goes up.)
英語のヒント
新しい油田の発見は、石油をより豊富にする。供給曲線が右へシフトし、均衡価格は下がり、均衡数量は増える。(供給曲線の移動によって均衡点が需要曲線に沿って下がるので、価格と数量は需要の法則に従う。価格が下がれば、数量は増える。) - When an economy slows down, it produces less output and demands less input, including energy, which is used in the production of virtually everything. A decrease in demand for energy will be reflected as a decrease in the demand for oil, or a leftward shift in demand for oil. Since the demand curve is shifting down the supply curve, both the equilibrium price and quantity of oil will fall.
英語のヒント
景気が減速すると生産量が減り、ほぼあらゆるものの生産に使われるエネルギーを含め、投入物への需要も減る。エネルギー需要の減少は石油需要の減少となり、需要曲線が左へシフトする。均衡点が供給曲線に沿って下がるので、石油の均衡価格と均衡数量はどちらも低下する。 - Disruption of oil pumping will reduce the supply of oil. This leftward shift in the supply curve will show a movement up the demand curve, resulting in an increase in the equilibrium price of oil and a decrease in the equilibrium quantity.
英語のヒント
採掘の中断は石油供給を減らす。供給曲線が左へシフトすると、均衡点は需要曲線に沿って上がり、石油の均衡価格は上昇し、均衡数量は減少する。 - Increased insulation will decrease the demand for heating. This leftward shift in the demand for oil causes a movement down the supply curve, resulting in a decrease in the equilibrium price and quantity of oil.
英語のヒント
断熱性が高まると暖房需要が減る。石油の需要曲線が左へシフトすると、均衡点は供給曲線に沿って下がり、均衡価格と均衡数量はどちらも低下する。 - Solar energy is a substitute for oil-based energy. So if solar energy becomes cheaper, the demand for oil will decrease as consumers switch from oil to solar. The decrease in demand for oil will be shown as a leftward shift in the demand curve. As the demand curve shifts down the supply curve, both equilibrium price and quantity for oil will fall.
英語のヒント
太陽エネルギーは石油由来のエネルギーの代替財である。太陽エネルギーが安くなると、消費者が石油から切り替えるため、石油需要が減る。これは需要曲線の左シフトで示される。均衡点が供給曲線に沿って下がるので、石油の均衡価格と均衡数量はどちらも低下する。 - A new, popular kind of plastic will increase the demand for oil. The increase in demand will be shown as a rightward shift in demand, raising the equilibrium price and quantity of oil.
英語のヒント
人気の高い新種のプラスチックは石油需要を増やす。需要増加は需要曲線の右シフトで示され、石油の均衡価格と均衡数量をともに押し上げる。