第3章需要と供給
3.1 Demand, Supply, and Equilibrium in Markets for Goods and Services3.1 財・サービス市場の需要、供給、均衡
Learning Objectives学習目標
Learning Objectives学習目標
By the end of this section, you will be able to:
英語のヒント
この節を学ぶと、次のことができるようになる。
- Explain demand, quantity demanded, and the law of demand
英語のヒント
需要、需要量、需要の法則を説明する。 - Explain supply, quantity supplied, and the law of supply
英語のヒント
供給、供給量、供給の法則を説明する。 - Identify a demand curve and a supply curve
英語のヒント
需要曲線と供給曲線を見分ける。 - Explain equilibrium, equilibrium price, and equilibrium quantity
英語のヒント
均衡、均衡価格、均衡数量を説明する。
First let’s first focus on what economists mean by demand, what they mean by supply, and then how demand and supply interact in a market.
英語のヒント
まず、経済学者が需要と供給という言葉で何を意味しているかを確認し、その後、市場で両者がどう相互作用するかに注目しよう。
Demand for Goods and Services財・サービスに対する需要
Economists use the term demand to refer to the amount of some good or service consumers are willing and able to purchase at each price. Demand is fundamentally based on needs and wants—if you have no need or want for something, you won't buy it. While a consumer may be able to differentiate between a need and a want, from an economist’s perspective they are the same thing. Demand is also based on ability to pay. If you cannot pay for it, you have no effective demand. By this definition, a person who does not have a drivers license has no effective demand for a car.
英語のヒント
経済学者は需要という言葉を、各価格で消費者が購入する意思と能力を持つ財・サービスの量を指すために使う。需要は基本的に必要と欲求に基づく。必要でも欲しくもないものは買わない。消費者自身は必要と欲求を区別できるかもしれないが、経済学者から見ると、どちらも同じことである。需要は支払能力にも基づく。代金を払えなければ、有効需要はない。この定義によれば、運転免許を持たない人には、自動車に対する有効需要がない。
What a buyer pays for a unit of the specific good or service is called price. The total number of units that consumers would purchase at that price is called the quantity demanded. A rise in price of a good or service almost always decreases the quantity demanded of that good or service. Conversely, a fall in price will increase the quantity demanded. When the price of a gallon of gasoline increases, for example, people look for ways to reduce their consumption by combining several errands, commuting by carpool or mass transit, or taking weekend or vacation trips closer to home. Economists call this inverse relationship between price and quantity demanded the law of demand. The law of demand assumes that all other variables that affect demand (which we explain in the next module) are held constant.
英語のヒント
特定の財・サービス1単位に対して買い手が払う額を、価格という。その価格で消費者が購入する総数量を、需要量という。財・サービスの価格が上がると、その需要量はほぼ必ず減る。逆に、価格が下がると需要量は増える。例えば、ガソリン1ガロンの価格が上がると、人々は複数の用事をまとめたり、相乗りや公共交通機関で通勤したり、週末や休暇の旅行先を近場にしたりして、消費を減らそうとする。経済学者は、価格と需要量のこの逆の関係を、需要の法則と呼ぶ。需要の法則は、需要に影響するほかのすべての変数(次の節で説明する)が一定であると仮定する。
We can show an example from the market for gasoline in a table or a graph. Economists call a table that shows the quantity demanded at each price, such as Table 3.1, a demand schedule. In this case we measure price in dollars per gallon of gasoline. We measure the quantity demanded in millions of gallons over some time period (for example, per day or per year) and over some geographic area (like a state or a country). A demand curve shows the relationship between price and quantity demanded on a graph like Figure 3.2, with quantity on the horizontal axis and the price per gallon on the vertical axis. (Note that this is an exception to the normal rule in mathematics that the independent variable (x) goes on the horizontal axis and the dependent variable (y) goes on the vertical axis. While economists often use math, they are different disciplines.)
英語のヒント
Table 3.1 shows the demand schedule and the graph in Figure 3.2 shows the demand curve. These are two ways to describe the same relationship between price and quantity demanded.
英語のヒント
Price (per gallon) 価格(1ガロン当たり) |
Quantity Demanded (millions of gallons) 需要量(100万ガロン) |
|---|---|
$1.00 |
800 |
$1.20 |
700 |
$1.40 |
600 |
$1.60 |
550 |
$1.80 |
500 |
$2.00 |
460 |
$2.20 |
420 |
A Demand Curve for Gasolineガソリンの需要曲線
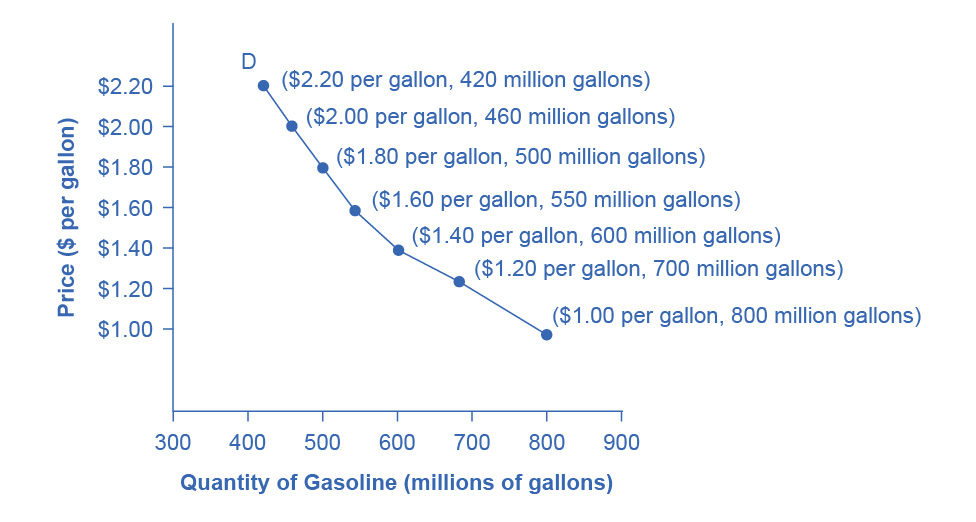

Figure 3.2図 3.2
The demand schedule shows that as price rises, quantity demanded decreases, and vice versa. We graph these points, and the line connecting them is the demand curve (D). The downward slope of the demand curve again illustrates the law of demand—the inverse relationship between prices and quantity demanded.
英語のヒント
需要表は、価格が上がると需要量が減り、逆も成り立つことを示す。これらの点をグラフに取り、結んだ線が需要曲線Dである。需要曲線の右下がりの傾きは、価格と需要量の逆の関係である需要の法則を示す。
Demand curves will appear somewhat different for each product. They may appear relatively steep or flat, or they may be straight or curved. Nearly all demand curves share the fundamental similarity that they slope down from left to right. Demand curves embody the law of demand: As the price increases, the quantity demanded decreases, and conversely, as the price decreases, the quantity demanded increases.
英語のヒント
需要曲線の見た目は製品ごとに多少異なる。傾きが急なことも緩やかなこともあり、直線のことも曲線のこともある。しかし、ほぼすべての需要曲線は、左から右へ下がるという基本的な共通点を持つ。需要曲線は需要の法則を具体的に表している。価格が上がると需要量は減り、逆に価格が下がると需要量は増える。
Confused about these different types of demand? Read the next Clear It Up feature.
英語のヒント
需要に関する言葉の違いに戸惑っているだろうか。次の「疑問を解消」を読んでみよう。