第3章需要と供給
How Does Income Affect Demand?所得は需要にどう影響するか
Let’s use income as an example of how factors other than price affect demand. Figure 3.5 shows the initial demand for automobiles as D0. At point Q, for example, if the price is $20,000 per car, the quantity of cars demanded is 18 million. D0 also shows how the quantity of cars demanded would change as a result of a higher or lower price. For example, if the price of a car rose to $22,000, the quantity demanded would decrease to 17 million, at point R.
英語のヒント
価格以外の要因が需要に与える影響を、所得を例に考えよう。図3.5では、自動車の当初の需要をD0で示している。例えば点Qでは、価格が1台20,000ドルなら、需要量は1,800万台である。D0は、価格が上がったり下がったりした場合の需要量の変化も示す。例えば価格が22,000ドルに上がると、点Rで示すように需要量は1,700万台へ減る。
The original demand curve D0, like every demand curve, is based on the ceteris paribus assumption that no other economically relevant factors change. Now imagine that the economy expands in a way that raises the incomes of many people, making cars more affordable. How will this affect demand? How can we show this graphically?
英語のヒント
元の需要曲線D0も、ほかのどの需要曲線とも同じく、関係するほかの経済的要因は変わらないという、セテリス・パリブスの仮定に基づく。ここで、景気が拡大して多くの人の所得が増え、自動車を買いやすくなったとしよう。需要はどうなるだろうか。グラフでどう示せるだろうか。
Return to Figure 3.5. The price of cars is still $20,000, but with higher incomes, the quantity demanded has now increased to 20 million cars, shown at point S. As a result of the higher income levels, the demand curve shifts to the right to the new demand curve D1, indicating an increase in demand. Table 3.4 shows clearly that this increased demand would occur at every price, not just the original one.
英語のヒント
Shifts in Demand: A Car Example需要のシフト――自動車の例
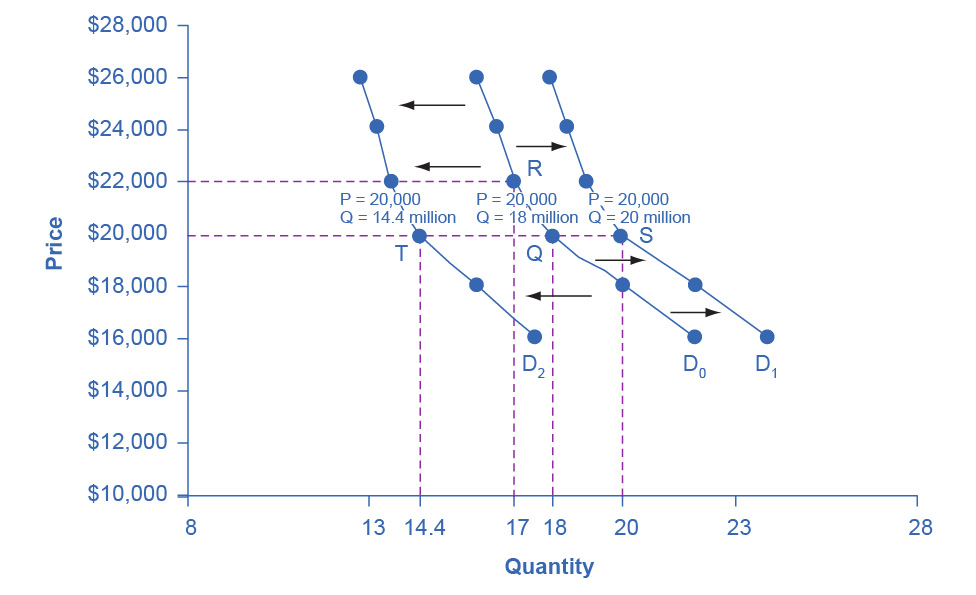

Figure 3.5図 3.5
Increased demand means that at every given price, the quantity demanded is higher, so that the demand curve shifts to the right from D0 to D1. Decreased demand means that at every given price, the quantity demanded is lower, so that the demand curve shifts to the left from D0 to D2.
英語のヒント
需要の増加とは、各価格での需要量が増え、需要曲線がD0からD1へ右にシフトすることである。需要の減少とは、各価格での需要量が減り、需要曲線がD0からD2へ左にシフトすることである。
Price 価格 |
Decrease to D2 D2へ減少 |
Original Quantity Demanded D0 元の需要量D0 |
Increase to D1 D1へ増加 |
|---|---|---|---|
$16,000 |
17.6 million 1,760万 |
22.0 million 2,200万 |
24.0 million 2,400万 |
$18,000 |
16.0 million 1,600万 |
20.0 million 2,000万 |
22.0 million 2,200万 |
$20,000 |
14.4 million 1,440万 |
18.0 million 1,800万 |
20.0 million 2,000万 |
$22,000 |
13.6 million 1,360万 |
17.0 million 1,700万 |
19.0 million 1,900万 |
$24,000 |
13.2 million 1,320万 |
16.5 million 1,650万 |
18.5 million 1,850万 |
$26,000 |
12.8 million 1,280万 |
16.0 million 1,600万 |
18.0 million 1,800万 |
Now, imagine that the economy slows down so that many people lose their jobs or work fewer hours, reducing their incomes. In this case, the decrease in income would lead to a lower quantity of cars demanded at every given price, and the original demand curve D0 would shift left to D2. The shift from D0 to D2 represents such a decrease in demand: At any given price level, the quantity demanded is now lower. In this example, a price of $20,000 means 18 million cars sold along the original demand curve, but only 14.4 million sold after demand fell.
英語のヒント
次に、景気が減速して、多くの人が失業したり労働時間が短くなったりし、所得が減ったとしよう。この場合、どの価格でも自動車の需要量が減り、元の需要曲線D0は左のD2へシフトする。D0からD2へのシフトは、こうした需要の減少を表す。どの価格水準でも需要量は以前より少ない。この例では、20,000ドルという価格で、元の需要曲線上では1,800万台が売れるが、需要減少後は1,440万台しか売れない。
When a demand curve shifts, it does not mean that the quantity demanded by every individual buyer changes by the same amount. In this example, not everyone would have higher or lower income and not everyone would buy or not buy an additional car. Instead, a shift in a demand curve captures a pattern for the market as a whole.
英語のヒント
需要曲線のシフトは、個々の買い手の需要量が全員同じだけ変わることを意味しない。この例でも、すべての人の所得が増減するわけではなく、すべての人が追加の自動車を買ったり、買わなくなったりするわけではない。需要曲線のシフトは、市場全体のパターンを捉えている。
In the previous section, we argued that higher income causes greater demand at every price. This is true for most goods and services. For some—luxury cars, vacations in Europe, and fine jewelry—the effect of a rise in income can be especially pronounced. A product whose demand rises when income rises, and vice versa, is called a normal good. A few exceptions to this pattern do exist. As incomes rise, many people will buy fewer generic brand groceries and more name brand groceries. They are less likely to buy used cars and more likely to buy new cars. They will be less likely to rent an apartment and more likely to own a home. A product whose demand falls when income rises, and vice versa, is called an inferior good. In other words, when income increases, the demand curve shifts to the left.
英語のヒント
前の部分では、所得が高くなると、どの価格でも需要が増えると述べた。これは大半の財・サービスに当てはまる。高級車、欧州旅行、高級宝飾品などでは、所得増加の効果が特に顕著な場合がある。所得が増えると需要が増え、逆も成り立つ製品を正常財という。このパターンには例外もある。所得が増えると、多くの人は無名ブランドの食料品を減らし、有名ブランドのものを増やす。中古車より新車を買い、賃貸住宅に住むより持ち家を選ぶようになる。所得が増えると需要が減り、逆も成り立つ製品を劣等財という。つまり、所得の増加により需要曲線は左へシフトする。
Other Factors That Shift Demand Curves需要曲線をシフトさせるほかの要因
Income is not the only factor that causes a shift in demand. Other factors that change demand include tastes and preferences, the composition or size of the population, the prices of related goods, and even expectations. A change in any one of the underlying factors that determine what quantity people are willing to buy at a given price will cause a shift in demand. Graphically, the new demand curve lies either to the right (an increase) or to the left (a decrease) of the original demand curve. Let’s look at these factors.
英語のヒント
需要をシフトさせるのは所得だけではない。嗜好や選好、人口の構成や規模、関連する財の価格、さらには予想も需要を変える。ある価格で人々がどれだけ買おうとするかを決める基礎的な要因のどれか一つが変われば、需要はシフトする。グラフでは、新しい需要曲線は元の曲線の右(増加)か左(減少)に位置する。これらの要因を見ていこう。
Changing Tastes or Preferences
英語のヒント
嗜好や選好の変化
From 1980 to 2021, the per-person consumption of chicken by Americans rose from 47 pounds per year to 97 pounds per year, and consumption of beef fell from 76 pounds per year to 59 pounds per year, according to the U.S. Department of Agriculture (USDA). Changes like these are largely due to movements in taste, which change the quantity of a good demanded at every price: that is, they shift the demand curve for that good, rightward for chicken and leftward for beef.
英語のヒント
米国農務省(USDA)によれば、1980年から2021年にかけて、米国人1人当たりの鶏肉消費量は年47ポンドから97ポンドに増え、牛肉は年76ポンドから59ポンドに減った。こうした変化は主に嗜好の変化によるもので、各価格での需要量を変える。つまり、鶏肉の需要曲線を右へ、牛肉の需要曲線を左へシフトさせる。
Changes in the Composition of the Population
英語のヒント
人口構成の変化
The proportion of elderly citizens in the United States population is rising. It rose from 9.8% in 1970 to 12.6% in 2000, and will be a projected (by the U.S. Census Bureau) 20% of the population by 2030. A society with relatively more children, like the United States in the 1960s, will have greater demand for goods and services like tricycles and day care facilities. A society with relatively more elderly persons, as the United States is projected to have by 2030, has a higher demand for nursing homes and hearing aids. Similarly, changes in the size of the population can affect the demand for housing and many other goods. Each of these changes in demand will be shown as a shift in the demand curve.
英語のヒント
米国の人口に占める高齢者の割合は上昇している。1970年の9.8%から2000年の12.6%へ増え、米国国勢調査局の予測では2030年に20%になる。1960年代の米国のように、子どもが比較的多い社会では、三輪車や保育施設などへの需要が大きい。2030年の米国で予想されるように、高齢者が比較的多い社会では、介護施設や補聴器への需要が大きい。同様に、人口規模の変化は、住宅や多くのほかの財の需要に影響する。これらの需要の変化はすべて、需要曲線のシフトとして示される。
Changes in the Prices of Related Goods
英語のヒント
関連する財の価格の変化
Changes in the prices of related goods such as substitutes or complements also can affect the demand for a product. A substitute is a good or service that we can use in place of another good or service. As electronic books, like this one, become more available, you would expect to see a decrease in demand for traditional printed books. A lower price for a substitute decreases demand for the other product. For example, in recent years as the price of tablet computers has fallen, the quantity demanded has increased (because of the law of demand). Since people are purchasing tablets, there has been a decrease in demand for laptops, which we can show graphically as a leftward shift in the demand curve for laptops. A higher price for a substitute good has the reverse effect.
英語のヒント
代替財や補完財など、関連する財の価格変化も、ある製品の需要に影響する。代替財とは、別の財・サービスの代わりに使える財・サービスである。本書のような電子書籍が普及すれば、従来の紙の本への需要は減ると予想できる。代替財の値下がりは、もう一方の製品への需要を減らす。例えば近年、タブレット端末の価格が下がるにつれて、需要の法則により、その需要量は増えた。人々がタブレットを買うので、ノートパソコンへの需要は減った。グラフでは、ノートパソコンの需要曲線の左へのシフトとして示せる。代替財の値上がりは、逆の効果を持つ。
Other goods are complements for each other, meaning we often use the goods together, because consumption of one good tends to enhance consumption of the other. Examples include breakfast cereal and milk; notebooks and pens or pencils, golf balls and golf clubs; gasoline and sport utility vehicles; and the five-way combination of bacon, lettuce, tomato, mayonnaise, and bread. If the price of golf clubs rises, since the quantity demanded of golf clubs falls (because of the law of demand), demand for a complement good like golf balls decreases, too. Similarly, a higher price for skis would shift the demand curve for a complement good like ski resort trips to the left, while a lower price for a complement has the reverse effect.
英語のヒント
互いに補完財となる財もある。一方の消費が他方の消費を促すため、一緒に使われることが多い財である。例えば、朝食用シリアルと牛乳、ノートとペンや鉛筆、ゴルフボールとゴルフクラブ、ガソリンとSUV、そしてベーコン・レタス・トマト・マヨネーズ・パンという五つの組み合わせがある。ゴルフクラブが値上がりすると、需要の法則によってクラブの需要量が減るので、補完財であるゴルフボールへの需要も減る。同様に、スキー板が値上がりすると、スキーリゾートへの旅行のような補完財の需要曲線は左へシフトする。補完財の値下がりは逆の効果を持つ。
Changes in Expectations about Future Prices or Other Factors that Affect Demand
英語のヒント
将来の価格や、需要に影響するほかの要因についての予想の変化
While it is clear that the price of a good affects the quantity demanded, it is also true that expectations about the future price (or expectations about tastes and preferences, income, and so on) can affect demand. For example, if people hear that a hurricane is coming, they may rush to the store to buy flashlight batteries and bottled water. If people learn that the price of a good like coffee is likely to rise in the future, they may head for the store to stock up on coffee now. We show these changes in demand as shifts in the curve. Therefore, a shift in demand happens when a change in some economic factor (other than price) causes a different quantity to be demanded at every price. The following Work It Out feature shows how this happens.
英語のヒント
財の価格が需要量に影響するのは明らかだが、将来の価格、あるいは嗜好・選好、所得などについての予想も需要に影響する。例えば、ハリケーンが来ると聞けば、懐中電灯用の電池や飲料水を買いに急ぐかもしれない。コーヒーのような財が将来値上がりしそうだと知れば、今のうちに買いだめしようと店へ向かうかもしれない。こうした需要の変化は、曲線のシフトとして示す。したがって、価格以外の経済的要因の変化によって、各価格での需要量が変わると、需要のシフトが起きる。次の「解いてみよう」で、その仕組みを示す。