第3章需要と供給
Supply of Goods and Services財・サービスの供給
When economists talk about supply, they mean the amount of some good or service a producer is willing to produce and/or bring to market at each price. Price is what the producer receives for selling one unit of a good or service. A rise in price almost always leads to an increase in the quantity supplied of that good or service, while a fall in price will decrease the quantity supplied. When the price of gasoline rises, for example, it encourages profit-seeking firms to take several actions: expand exploration for oil reserves; drill for more oil; invest in more pipelines and oil tankers to bring the oil to plants for refining into gasoline; build new oil refineries; purchase additional pipelines and trucks to ship the gasoline to gas stations; and open more gas stations or keep existing gas stations open longer hours. Economists call this positive relationship between price and quantity supplied—that a higher price leads to a higher quantity supplied and a lower price leads to a lower quantity supplied—the law of supply. The law of supply assumes that all other variables that affect supply (to be explained in the next module) are held constant.
英語のヒント
経済学者が供給というときは、各価格で生産者が生産したり、市場に出したりする意思のある財・サービスの量を意味する。価格は、財・サービス1単位を売って生産者が受け取る額である。価格が上がると、その財・サービスの供給量はほぼ必ず増え、価格が下がると供給量は減る。例えば、ガソリン価格が上がると、利益を求める企業はいくつかの行動を取るよう促される。石油埋蔵地の探査を広げる、さらに掘削する、ガソリンへ精製する工場に原油を運ぶパイプラインやタンカーへ投資する、新しい製油所を建てる、ガソリンスタンドへ輸送するためのパイプラインやトラックを追加する、スタンドを増やすか営業時間を延ばす、といった行動である。経済学者は、価格が高いほど供給量が多く、低いほど少ないという、この正の関係を供給の法則と呼ぶ。供給の法則は、供給に影響するほかのすべての変数(次の節で説明する)が一定であると仮定する。
Still unsure about the different types of supply? See the following Clear It Up feature.
英語のヒント
供給に関する言葉の違いがまだはっきりしないだろうか。次の「疑問を解消」を見てみよう。
Figure 3.3 illustrates the law of supply, again using the market for gasoline as an example. Like demand, we can illustrate supply using a table or a graph. A supply schedule is a table, like Table 3.2, that shows the quantity supplied at a range of different prices. Again, we measure price in dollars per gallon of gasoline and we measure quantity supplied in millions of gallons. A supply curve is a graphic illustration of the relationship between price, shown on the vertical axis, and quantity, shown on the horizontal axis. The supply schedule and the supply curve are just two different ways of showing the same information. Notice that the horizontal and vertical axes on the graph for the supply curve are the same as for the demand curve.
英語のヒント
A Supply Curve for Gasolineガソリンの供給曲線
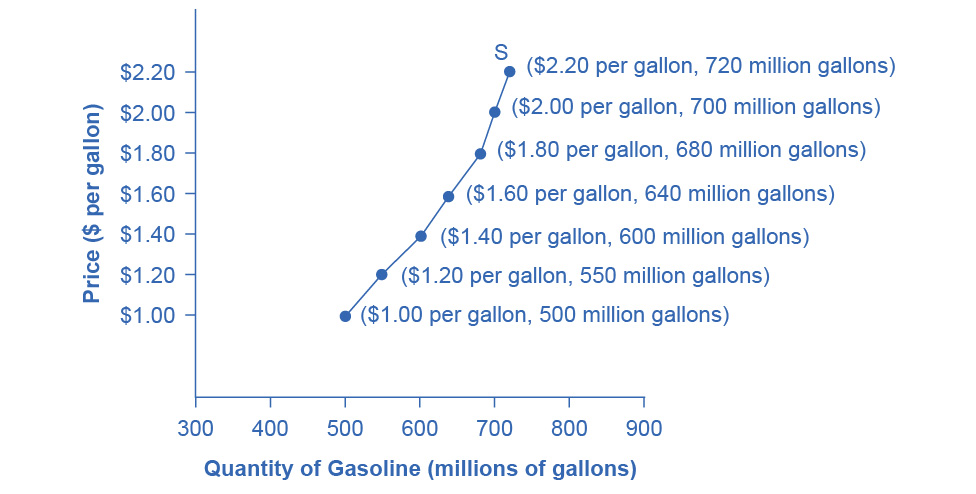
Figure 3.3図 3.3
The supply schedule is the table that shows quantity supplied of gasoline at each price. As price rises, quantity supplied also increases, and vice versa. The supply curve (S) is created by graphing the points from the supply schedule and then connecting them. The upward slope of the supply curve illustrates the law of supply—that a higher price leads to a higher quantity supplied, and vice versa.
英語のヒント
供給表は、各価格でのガソリンの供給量を示す表である。価格が上がると供給量も増え、逆も成り立つ。供給表の点をグラフに取り、結んだものが供給曲線Sである。右上がりの傾きは、価格が高いほど供給量が多く、逆も成り立つという供給の法則を示す。
Price (per gallon) 価格(1ガロン当たり) |
Quantity Supplied (millions of gallons) 供給量(100万ガロン) |
|---|---|
$1.00 |
500 |
$1.20 |
550 |
$1.40 |
600 |
$1.60 |
640 |
$1.80 |
680 |
$2.00 |
700 |
$2.20 |
720 |
The shape of supply curves will vary somewhat according to the product: steeper, flatter, straighter, or curved. Nearly all supply curves, however, share a basic similarity: they slope up from left to right and illustrate the law of supply: as the price rises, say, from $1.00 per gallon to $2.20 per gallon, the quantity supplied increases from 500 gallons to 720 gallons. Conversely, as the price falls, the quantity supplied decreases.
英語のヒント
供給曲線の形は製品によって多少異なり、急なもの、平坦なもの、直線的なもの、曲がったものがある。しかし、ほぼすべての供給曲線には基本的な共通点がある。左から右へ上がり、供給の法則を示すことである。例えば価格が1ガロン1.00ドルから2.20ドルに上がると、供給量は500ガロンから720ガロンに増える。逆に、価格が下がると供給量は減る。
Equilibrium—Where Demand and Supply Intersect均衡――需要と供給が交わるところ
Because the graphs for demand and supply curves both have price on the vertical axis and quantity on the horizontal axis, the demand curve and supply curve for a particular good or service can appear on the same graph. Together, demand and supply determine the price and the quantity that will be bought and sold in a market.
英語のヒント
需要曲線も供給曲線も縦軸に価格、横軸に数量を取るので、特定の財・サービスについて同じグラフに描ける。需要と供給は一緒に、市場で売買される価格と数量を決める。
Figure 3.4 illustrates the interaction of demand and supply in the market for gasoline. The demand curve (D) is identical to Figure 3.2. The supply curve (S) is identical to Figure 3.3. Table 3.3 contains the same information in tabular form.
英語のヒント
Demand and Supply for Gasolineガソリンの需要と供給
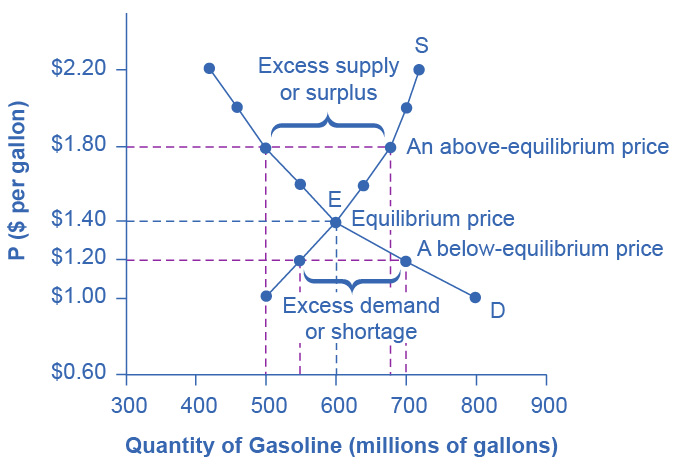


Figure 3.4図 3.4
The demand curve (D) and the supply curve (S) intersect at the equilibrium point E, with a price of $1.40 and a quantity of 600. The equilibrium price is the only price where quantity demanded is equal to quantity supplied. At a price above equilibrium like $1.80, quantity supplied exceeds the quantity demanded, so there is excess supply. At a price below equilibrium such as $1.20, quantity demanded exceeds quantity supplied, so there is excess demand.
英語のヒント
需要曲線Dと供給曲線Sは、価格1.40ドル、数量600の均衡点Eで交わる。均衡価格は、需要量と供給量が等しくなる唯一の価格である。1.80ドルのように均衡より高い価格では、供給量が需要量を上回り、超過供給が生じる。1.20ドルのように均衡より低い価格では、需要量が供給量を上回り、超過需要が生じる。
Price (per gallon) 価格(1ガロン当たり) |
Quantity demanded (millions of gallons) 需要量(100万ガロン) |
Quantity supplied (millions of gallons) 供給量(100万ガロン) |
|---|---|---|
$1.00 |
800 |
500 |
$1.20 |
700 |
550 |
$1.40 |
600 |
600 |
$1.60 |
550 |
640 |
$1.80 |
500 |
680 |
$2.00 |
460 |
700 |
$2.20 |
420 |
720 |
Remember this: When two lines on a diagram cross, this intersection usually means something. The point where the supply curve (S) and the demand curve (D) cross, designated by point E in Figure 3.4, is called the equilibrium. The equilibrium price is the only price where the plans of consumers and the plans of producers agree—that is, where the amount of the product consumers want to buy (quantity demanded) is equal to the amount producers want to sell (quantity supplied). Economists call this common quantity the equilibrium quantity. At any other price, the quantity demanded does not equal the quantity supplied, so the market is not in equilibrium at that price.
英語のヒント
図で二つの線が交わるとき、その交点には通常、意味があることを覚えておこう。供給曲線Sと需要曲線Dが交わる点を均衡という。図3.4では点Eで示している。均衡価格は、消費者の計画と生産者の計画が一致する唯一の価格である。すなわち、消費者が買いたい量(需要量)と、生産者が売りたい量(供給量)が等しくなる価格である。この共通の数量を均衡数量という。それ以外の価格では需要量と供給量が等しくないので、市場は均衡していない。
In Figure 3.4, the equilibrium price is $1.40 per gallon of gasoline and the equilibrium quantity is 600 million gallons. If you had only the demand and supply schedules, and not the graph, you could find the equilibrium by looking for the price level on the tables where the quantity demanded and the quantity supplied are equal.
英語のヒント
図3.4では、均衡価格はガソリン1ガロン当たり1.40ドル、均衡数量は6億ガロンである。グラフがなく、需要表と供給表しかなくても、表の中で需要量と供給量が等しくなる価格を探せば、均衡を求められる。
The word “equilibrium” means “balance.” If a market is at its equilibrium price and quantity, then it has no reason to move away from that point. However, if a market is not at equilibrium, then economic pressures arise to move the market toward the equilibrium price and the equilibrium quantity.
英語のヒント
「均衡」という言葉は「つり合い」を意味する。市場が均衡価格・均衡数量にあれば、その点から離れる理由はない。しかし、市場が均衡していなければ、均衡価格と均衡数量へ向かわせる経済的な圧力が生まれる。
Imagine, for example, that the price of a gallon of gasoline was above the equilibrium price—that is, instead of $1.40 per gallon, the price is $1.80 per gallon. The dashed horizontal line at the price of $1.80 in Figure 3.4 illustrates this above-equilibrium price. At this higher price, the quantity demanded drops from 600 to 500. This decline in quantity reflects how consumers react to the higher price by finding ways to use less gasoline.
英語のヒント
例えば、ガソリン1ガロンの価格が均衡価格より高く、1.40ドルではなく1.80ドルだとしよう。図3.4の1.80ドルの水平な破線が、この均衡を上回る価格を示している。価格が高いと、需要量は600から500へ減る。この減少は、消費者がガソリン使用を減らす方法を探し、価格の上昇に対応することを反映している。
Moreover, at this higher price of $1.80, the quantity of gasoline supplied rises from 600 to 680, as the higher price makes it more profitable for gasoline producers to expand their output. Now, consider how quantity demanded and quantity supplied are related at this above-equilibrium price. Quantity demanded has fallen to 500 gallons, while quantity supplied has risen to 680 gallons. In fact, at any above-equilibrium price, the quantity supplied exceeds the quantity demanded. We call this an excess supply or a surplus.
英語のヒント
さらに、この高い価格1.80ドルでは、ガソリンの供給量は600から680に増える。価格上昇によって、生産者にとって増産の採算がよくなるためである。ここで、均衡より高い価格での需要量と供給量の関係を考えよう。需要量は500ガロンに減り、供給量は680ガロンに増えた。実際、均衡を上回るどの価格でも、供給量は需要量を上回る。この状態を超過供給、または余剰という。
With a surplus, gasoline accumulates at gas stations, in tanker trucks, in pipelines, and at oil refineries. This accumulation puts pressure on gasoline sellers. If a surplus remains unsold, those firms involved in making and selling gasoline are not receiving enough cash to pay their workers and to cover their expenses. In this situation, some producers and sellers will want to cut prices, because it is better to sell at a lower price than not to sell at all. Once some sellers start cutting prices, others will follow to avoid losing sales. These price reductions in turn will stimulate a higher quantity demanded. Therefore, if the price is above the equilibrium level, incentives built into the structure of demand and supply will create pressures for the price to fall toward the equilibrium.
英語のヒント
余剰が生じると、ガソリンはスタンド、タンクローリー、パイプライン、製油所にたまる。この在庫の蓄積は、売り手に圧力をかける。余剰が売れ残ると、生産・販売企業は、従業員の賃金や諸費用を賄う十分な現金を得られない。こうなると、一部の生産者や売り手は値下げしようとする。まったく売れないより、安くても売れたほうがよいからである。一部の売り手が値下げを始めると、ほかの売り手も売上を失わないよう追随する。値下げはさらに需要量の増加を促す。したがって、価格が均衡水準より高いと、需要と供給の構造に組み込まれた誘因が働き、均衡へ向けて価格を下げる圧力を生む。
Now suppose that the price is below its equilibrium level at $1.20 per gallon, as the dashed horizontal line at this price in Figure 3.4 shows. At this lower price, the quantity demanded increases from 600 to 700 as drivers take longer trips, spend more minutes warming up the car in the driveway in wintertime, stop sharing rides to work, and buy larger cars that get fewer miles to the gallon. However, the below-equilibrium price reduces gasoline producers’ incentives to produce and sell gasoline, and the quantity supplied falls from 600 to 550.
英語のヒント
次に、図3.4のもう一つの水平な破線が示すように、価格が均衡より低い1ガロン1.20ドルだとしよう。この低価格では、運転者が遠くへ旅行し、冬に自宅の車道で車を暖機する時間を延ばし、通勤の相乗りをやめ、燃費の悪い大型車を買うため、需要量は600から700に増える。しかし、均衡より低い価格は、生産者がガソリンを生産・販売する誘因を弱め、供給量は600から550へ減る。
When the price is below equilibrium, there is excess demand, or a shortage—that is, at the given price the quantity demanded, which has been stimulated by the lower price, now exceeds the quantity supplied, which has been depressed by the lower price. In this situation, eager gasoline buyers mob the gas stations, only to find many stations running short of fuel. Oil companies and gas stations recognize that they have an opportunity to make higher profits by selling what gasoline they have at a higher price. As a result, the price rises toward the equilibrium level. Read Demand, Supply, and Efficiency for more discussion on the importance of the demand and supply model.
英語のヒント
価格が均衡より低いと、超過需要、すなわち不足が生じる。低価格によって増えた需要量が、その同じ低価格によって減った供給量を上回るのである。買い手がガソリンスタンドに押し寄せても、多くの店で燃料が足りないことがわかる。石油会社やスタンドは、手元にあるガソリンをより高く売れば利益を増やせると気付く。その結果、価格は均衡水準へ向けて上がる。需要と供給のモデルの重要性については、「需要・供給と効率性」でさらに論じる。