第21章失業
Structural Unemployment構造的失業
Another factor that influences the natural rate of unemployment is the amount of structural unemployment. The structurally unemployed are individuals who have no jobs because they lack skills valued by the labor market, either because demand has shifted away from the skills they do have, or because they never learned any skills. An example of the former would be the unemployment among aerospace engineers after the U.S. space program downsized in the 1970s. An example of the latter would be high school dropouts.
英語のヒント
自然失業率に影響するもう一つの要因は、構造的失業の大きさである。構造的失業者とは、労働市場で評価される技能を持たないために仕事のない人々である。自分の技能から需要が離れた場合と、そもそも技能を身につけたことがない場合がある。前者の例は、1970年代に米国の宇宙計画が縮小した後の航空宇宙技術者の失業である。後者の例は、高校中退者である。
Some people worry that technology causes structural unemployment. In the past, new technologies have put lower skilled employees out of work, but at the same time they create demand for higher skilled workers to use the new technologies. Education seems to be the key in minimizing the amount of structural unemployment. Individuals who have degrees can be retrained if they become structurally unemployed. For people with no skills and little education, that option is more limited.
英語のヒント
技術が構造的失業を引き起こすと心配する人もいる。過去には新技術が低技能の従業員を失職させてきたが、同時に、その技術を使う高技能労働者への需要も生み出してきた。構造的失業を最小にする鍵は、教育にあるようである。学位を持つ人は、構造的失業に陥っても再訓練を受けられる。技能がなく教育も乏しい人にとって、その選択肢はより限られている。
Natural Unemployment and Potential Real GDP自然失業と潜在実質GDP
The natural unemployment rate is related to two other important concepts: full employment and potential real GDP. Economists consider the economy to be at full employment when the actual unemployment rate is equal to the natural unemployment rate. When the economy is at full employment, real GDP is equal to potential real GDP. By contrast, when the economy is below full employment, the unemployment rate is greater than the natural unemployment rate and real GDP is less than potential. Finally, when the economy is above full employment, then the unemployment rate is less than the natural unemployment rate and real GDP is greater than potential. Operating above potential is only possible for a short while, since it is analogous to all workers working overtime.
英語のヒント
自然失業率は、完全雇用と潜在実質GDPという、他の二つの重要な概念と関係している。経済学者は、実際の失業率が自然失業率に等しいとき、経済は完全雇用にあると考える。完全雇用では、実質GDPは潜在実質GDPに等しい。対照的に、完全雇用を下回る経済では、失業率は自然失業率より高く、実質GDPは潜在水準を下回る。最後に、完全雇用を上回る経済では、失業率は自然失業率より低く、実質GDPは潜在水準より高い。潜在水準を超える操業が可能なのは短期間に限られる。すべての労働者が残業しているような状態だからである。
Productivity Shifts and the Natural Rate of Unemployment生産性の変化と自然失業率
Unexpected shifts in productivity can have a powerful effect on the natural rate of unemployment. Over time, workers' productivity determines the level of wages in an economy. After all, if a business paid workers more than could be justified by their productivity, the business will ultimately lose money and go bankrupt. Conversely, if a business tries to pay workers less than their productivity then, in a competitive labor market, other businesses will find it worthwhile to hire away those workers and pay them more.
英語のヒント
予想外の生産性の変化は、自然失業率に大きな影響を与えうる。長い目でみると、労働者の生産性が経済の賃金水準を決める。結局、企業が生産性によって正当化できる以上の賃金を払えば、いずれ損失を出して倒産する。逆に企業が、生産性を下回る賃金を払おうとすれば、競争的な労働市場では、他社がその労働者を引き抜いて高い賃金を払う価値があると判断する。
However, adjustments of wages to productivity levels will not happen quickly or smoothly. Employers typically review wages only once or twice a year. In many modern jobs, it is difficult to measure productivity at the individual level. For example, how precisely would one measure the quantity produced by an accountant who is one of many people working in the tax department of a large corporation? Because productivity is difficult to observe, employers often determine wage increases based on recent experience with productivity. If productivity has been rising at, say, 2% per year, then wages rise at that level as well. However, when productivity changes unexpectedly, it can affect the natural rate of unemployment for a time.
英語のヒント
しかし、生産性の水準に合わせた賃金の調整は、速くも円滑にも起こらない。雇用主が賃金を見直すのは、通常、年に1、2回だけである。現代の多くの仕事では、個人単位の生産性を測ることが難しい。たとえば大企業の税務部門で働く大勢の一人である会計士について、その生産量を正確にどう測れるだろうか。生産性を観察するのは難しいため、雇用主は、生産性に関する最近の経験に基づいて賃上げを決めることが多い。たとえば生産性が年2%ずつ上がっていれば、賃金もその率で上がる。しかし生産性が予想外に変化すると、一時的に自然失業率へ影響を与えることがある。
The U.S. economy in the 1970s and 1990s provides two vivid examples of this process. In the 1970s, productivity growth slowed down unexpectedly (as we discussed in Economic Growth). For example, output per hour of U.S. workers in the business sector increased at an annual rate of 3.3% per year from 1960 to 1973, but only 0.8% from 1973 to 1982. Figure 21.8 (a) illustrates the situation where the demand for labor—that is, the quantity of labor that business is willing to hire at any given wage—has been shifting out a little each year because of rising productivity, from D0 to D1 to D2. As a result, equilibrium wages have been rising each year from W0 to W1 to W2. However, when productivity unexpectedly slows down, the pattern of wage increases does not adjust right away. Wages keep rising each year from W2 to W3 to W4, but the demand for labor is no longer shifting up. A gap opens where the quantity of labor supplied at wage level W4 is greater than the quantity demanded. The natural rate of unemployment rises. In the aftermath of this unexpectedly low productivity in the 1970s, the national unemployment rate did not fall below 7% from May, 1980 until 1986. Over time, the rise in wages will adjust to match the slower gains in productivity, and the unemployment rate will ease back down, but this process may take years.
英語のヒント
1970年代と1990年代の米国経済は、この過程の鮮明な二つの例を示す。1970年代には、「経済成長」で論じたように、生産性の伸びが予想外に鈍化した。たとえば米国の企業部門の労働者の時間当たり生産は、1960~1973年には年3.3%増えたが、1973~1982年には年0.8%しか増えなかった。図21.8(a)は、生産性の上昇によって労働需要、すなわち一定の賃金で企業が雇おうとする労働量が、D0からD1、D2へと毎年少しずつ外側へシフトしてきた状況を示す。その結果、均衡賃金は毎年W0からW1、W2へ上昇してきた。しかし生産性が予想外に鈍化しても、賃上げのパターンはすぐには調整されない。賃金はW2からW3、W4へと毎年上がり続けるが、労働需要はもはや上方へシフトしていない。賃金水準W4での労働供給量が需要量を上回り、差が生じる。自然失業率が上昇する。1970年代のこの予想外に低い生産性の後、全国の失業率は1980年5月から1986年まで7%を下回らなかった。時間がたてば賃金上昇は、生産性の緩やかな伸びに合うよう調整され、失業率は次第に下がるが、この過程には何年もかかることがある。
Unexpected Productivity Changes and Unemployment予想外の生産性の変化と失業
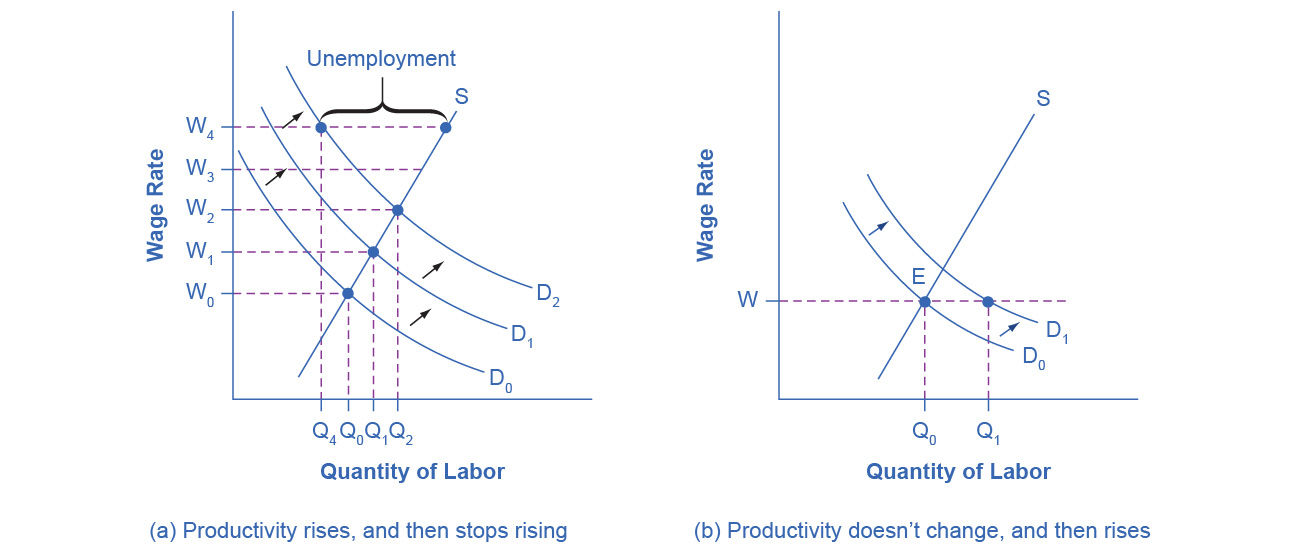

Figure 21.8図 21.8
(a) Productivity is rising, increasing the demand for labor. Employers and workers become used to the pattern of wage increases. Then productivity suddenly stops increasing. However, there is a delay or lag in the recognition that productivity is no longer increasing. As a result, wages keep rising as before, but the demand for labor is no longer increasing, so at wage W3 and wage W4, unemployment exists where the quantity supplied of labor exceeds the quantity demanded. (b) The rate of productivity increase has been zero for a time, so employers and workers have come to accept the equilibrium wage level (W). Then productivity increases unexpectedly, shifting demand for labor from D0 to D1. At the wage (W), this means that the quantity demanded of labor exceeds the quantity supplied, and with job offers plentiful, the unemployment rate will be low.
英語のヒント
(a)生産性が上がり、労働需要が増えている。雇用主と労働者は賃上げのパターンに慣れる。その後、生産性の上昇が突然止まる。しかし、生産性がもう上昇していないという認識には遅れがある。その結果、賃金は以前と同じように上がり続けるが、労働需要はもはや増えていない。そのため、賃金W3とW4では、労働供給量が需要量を上回る分の失業が生じる。(b)生産性上昇率がしばらくゼロだったため、雇用主と労働者は均衡賃金Wを受け入れるようになった。その後、生産性が予想外に上がり、労働需要がD0からD1へシフトする。賃金Wでは労働需要量が供給量を上回ることを意味し、求人が豊富なので、失業率は低くなる。
The late 1990s provide an opposite example: instead of the surprise decline in productivity that occurred in the 1970s, productivity unexpectedly rose in the mid-1990s. The annual growth rate of real output per hour of labor increased from 1.7% from 1980–1995, to an annual rate of 2.6% from 1995–2001. Let’s simplify the situation a bit, so that the economic lesson of the story is easier to see graphically, and say that productivity had not been increasing at all in earlier years, so the intersection of the labor market was at point E in Figure 21.8 (b), where the demand curve for labor (D0) intersects the supply curve for labor. As a result, real wages were not increasing. Now, productivity jumps upward, which shifts the demand for labor out to the right, from D0 to D1. At least for a time, however, wages are still set according to the earlier expectations of no productivity growth, so wages do not rise. The result is that at the prevailing wage level (W), the quantity of labor demanded (Qd) will for a time exceed the quantity of labor supplied (Qs), and unemployment will be very low—actually below the natural level of unemployment for a time. This pattern of unexpectedly high productivity helps to explain why the unemployment rate stayed below 4.5%—quite a low level by historical standards—from 1998 until after the U.S. economy had entered a recession in 2001.
英語のヒント
1990年代後半は反対の例を示す。1970年代に起きた予想外の生産性低下とは逆に、1990年代半ばには生産性が予想外に上がった。労働1時間当たり実質生産の年間成長率は、1980~1995年の1.7%から、1995~2001年の2.6%に高まった。この話の経済的な教訓を図で分かりやすくするため、状況を少し単純化し、それ以前には生産性がまったく上がっていなかったとしよう。このとき、労働市場の交点は図21.8(b)の点E、すなわち労働需要曲線D0と労働供給曲線の交点だった。その結果、実質賃金は上がっていなかった。ここで生産性が急上昇すると、労働需要はD0からD1へ、右外側にシフトする。しかし少なくともしばらくは、生産性は伸びないという以前の予想に基づいて賃金が設定されるため、賃金は上がらない。その結果、現行賃金Wでは、労働需要量(Qd)が一時的に労働供給量(Qs)を超え、失業率は非常に低くなる。実際、一時的に自然失業水準を下回る。この予想外に高い生産性のパターンは、1998年から米国経済が2001年の景気後退に入った後まで、失業率が歴史的な基準でかなり低い4.5%未満にとどまった理由を説明するのに役立つ。
Levels of unemployment will tend to be somewhat higher on average when productivity is unexpectedly low, and conversely, will tend to be somewhat lower on average when productivity is unexpectedly high. However, over time, wages do eventually adjust to reflect productivity levels.
英語のヒント
生産性が予想外に低いとき、失業は平均でやや高くなる傾向があり、逆に生産性が予想外に高いとき、平均でやや低くなる傾向がある。しかし時間がたてば、賃金はいずれ生産性の水準を反映するよう調整される。