第21章失業
21.2 Patterns of Unemployment21.2 失業のパターン
Learning Objectives学習目標
Learning Objectives学習目標
By the end of this section, you will be able to:
英語のヒント
この節を学ぶと、次のことができるようになる。
- Explain historical patterns of unemployment in the U.S.
英語のヒント
米国の失業の歴史的パターンを説明する - Identify trends of unemployment based on demographics
英語のヒント
人口属性に基づく失業の傾向を特定する - Evaluate global unemployment rates
英語のヒント
世界の失業率を評価する
Let’s look at how unemployment rates have changed over time and how various groups of people are affected by unemployment differently.
英語のヒント
失業率が時間とともにどう変化してきたか、また、さまざまな人々の集団が失業からどのように異なる影響を受けるかを見てみよう。
The Historical U.S. Unemployment Rate米国の失業率の歴史
Figure 21.3 shows the historical pattern of U.S. unemployment since 1955.
英語のヒント
図21.3は、1955年以降の米国の失業率の歴史的なパターンを示している。
The U.S. Unemployment Rate, 1948–2020米国の失業率、1948–2020年
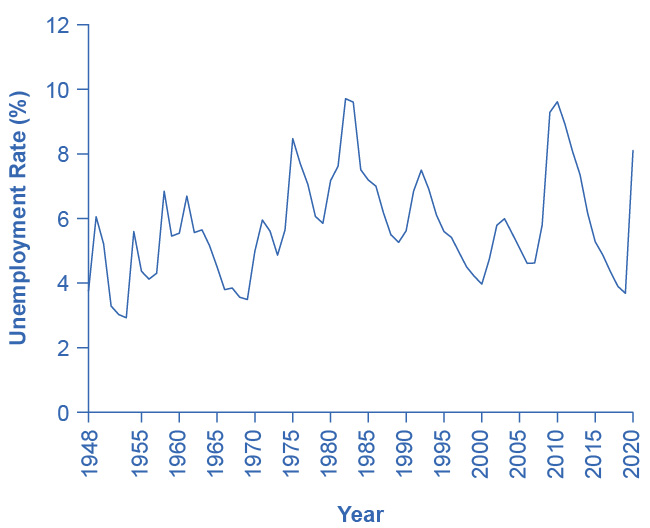
Figure 21.3図 21.3
The U.S. unemployment rate moves up and down as the economy moves in and out of recessions. However, over time, the unemployment rate seems to return to a range of 4% to 6%. There does not seem to be a long-term trend toward the rate moving generally higher or generally lower. (Source: Federal Reserve Economic Data (FRED), Unemployment Rate (UNRATE), https://fred.stlouisfed.org/series/UNRATE)
英語のヒント
米国の失業率は、経済が景気後退に入り、抜け出すのに伴って上下する。しかし時間がたつと、失業率は4~6%の範囲に戻るようにみえる。全般的に高く、あるいは低くなっていく長期的傾向はみられない。(出典:連邦準備経済データ(FRED)、失業率(UNRATE)、https://fred.stlouisfed.org/series/UNRATE)
As we look at this data, several patterns stand out:
英語のヒント
このデータをみると、いくつかのパターンが目立つ。
- Unemployment rates do fluctuate over time. During the deep recessions of the early 1980s, 2007–2009, and 2021, unemployment reached roughly 10%. For comparison, during the 1930s Great Depression, the unemployment rate reached almost 25% of the labor force.
英語のヒント
失業率は時間とともに確かに変動する。1980年代初め、2007~2009年、2021年の深刻な景気後退では、失業率は約10%に達した。比較すると、1930年代の大恐慌では、失業率は労働力人口のほぼ25%に達した。 - Unemployment rates in the late 1990s and into the mid-2000s were rather low by historical standards. The unemployment rate was below 5% from 1997 to 2000, and near 5% during almost all of 2006–2007, and 5% or less from September 2015 through March 2020. The previous time unemployment had been less than 5% for three consecutive years was three decades earlier, from 1968 to 1970.
英語のヒント
1990年代後半から2000年代半ばの失業率は、歴史的な基準ではかなり低かった。1997~2000年には5%未満で、2006~2007年のほぼ全期間には5%近く、2015年9月から2020年3月までは5%以下だった。それ以前に失業率が3年連続で5%未満だったのは、30年前の1968~1970年である。 - The unemployment rate never falls all the way to zero. It almost never seems to get below 3%—and it stays that low only for very short periods. (We discuss reasons why this is the case later in this chapter.)
英語のヒント
失業率が完全にゼロまで下がることはない。3%を下回ることはほとんどなく、そこまで低い水準にとどまるのもごく短期間である。(その理由は、この章の後半で論じる。) - The timing of rises and falls in unemployment matches fairly well with the timing of upswings and downswings in the overall economy, except that unemployment tends to lag changes in economic activity, and especially so during upswings of the economy following a recession. During periods of recession and depression, unemployment is high. During periods of economic growth, unemployment tends to be lower.
英語のヒント
失業の増減の時期は、経済全体の上昇・下降の時期とかなりよく一致する。ただし、失業は経済活動の変化に遅れる傾向があり、特に景気後退後の回復局面でそうなる。景気後退や不況の時期には失業率は高い。経済成長の時期には、失業率は低くなる傾向がある。 - No significant upward or downward trend in unemployment rates is apparent. This point is especially worth noting because the U.S. population more than quadrupled from 76 million in 1900 to over 324 million by 2017. Moreover, a higher proportion of U.S. adults are now in the paid workforce, because women have entered the paid labor force in significant numbers in recent decades. Women comprised 18% of the paid workforce in 1900 and nearly half of the paid workforce in 2021. However, despite the increased number of workers, as well as other economic events like globalization and the continuous invention of new technologies, the economy has provided jobs without causing any long-term upward or downward trend in unemployment rates.
英語のヒント
失業率に、明確な上昇傾向や低下傾向はみられない。米国の人口が1900年の7600万人から2017年までに3億2400万人以上へ、4倍以上になったことを考えると、この点は特に注目に値する。さらに、ここ数十年間に多数の女性が有給労働に参加したため、現在は米国の成人のうち有給で働く人の割合が高くなっている。女性は1900年には有給労働者の18%を占め、2021年にはほぼ半数を占めた。しかし労働者数の増加や、グローバル化、新技術の継続的な発明といった他の経済的出来事にもかかわらず、経済は失業率に長期的な上昇傾向や低下傾向を生じさせずに仕事を提供してきた。
Unemployment Rate from 1948. Similar to the graph in the figure above, the rate moves up and down as the economy moves in and out of recessions.
英語のヒント
1948年以降の失業率。上の図のグラフと同様、経済が景気後退に入り、抜け出すのに伴って失業率は上下する。
Unemployment Rates by Group集団別の失業率
Unemployment is not distributed evenly across the U.S. population. Figure 21.4 shows unemployment rates broken down in various ways: by gender, age, and race/ethnicity.
英語のヒント
失業は米国の人口全体に均等には分布していない。図21.4は、性別、年齢、人種・民族というさまざまな区分による失業率を示している。
Unemployment Rate by Demographic Group人口集団別の失業率
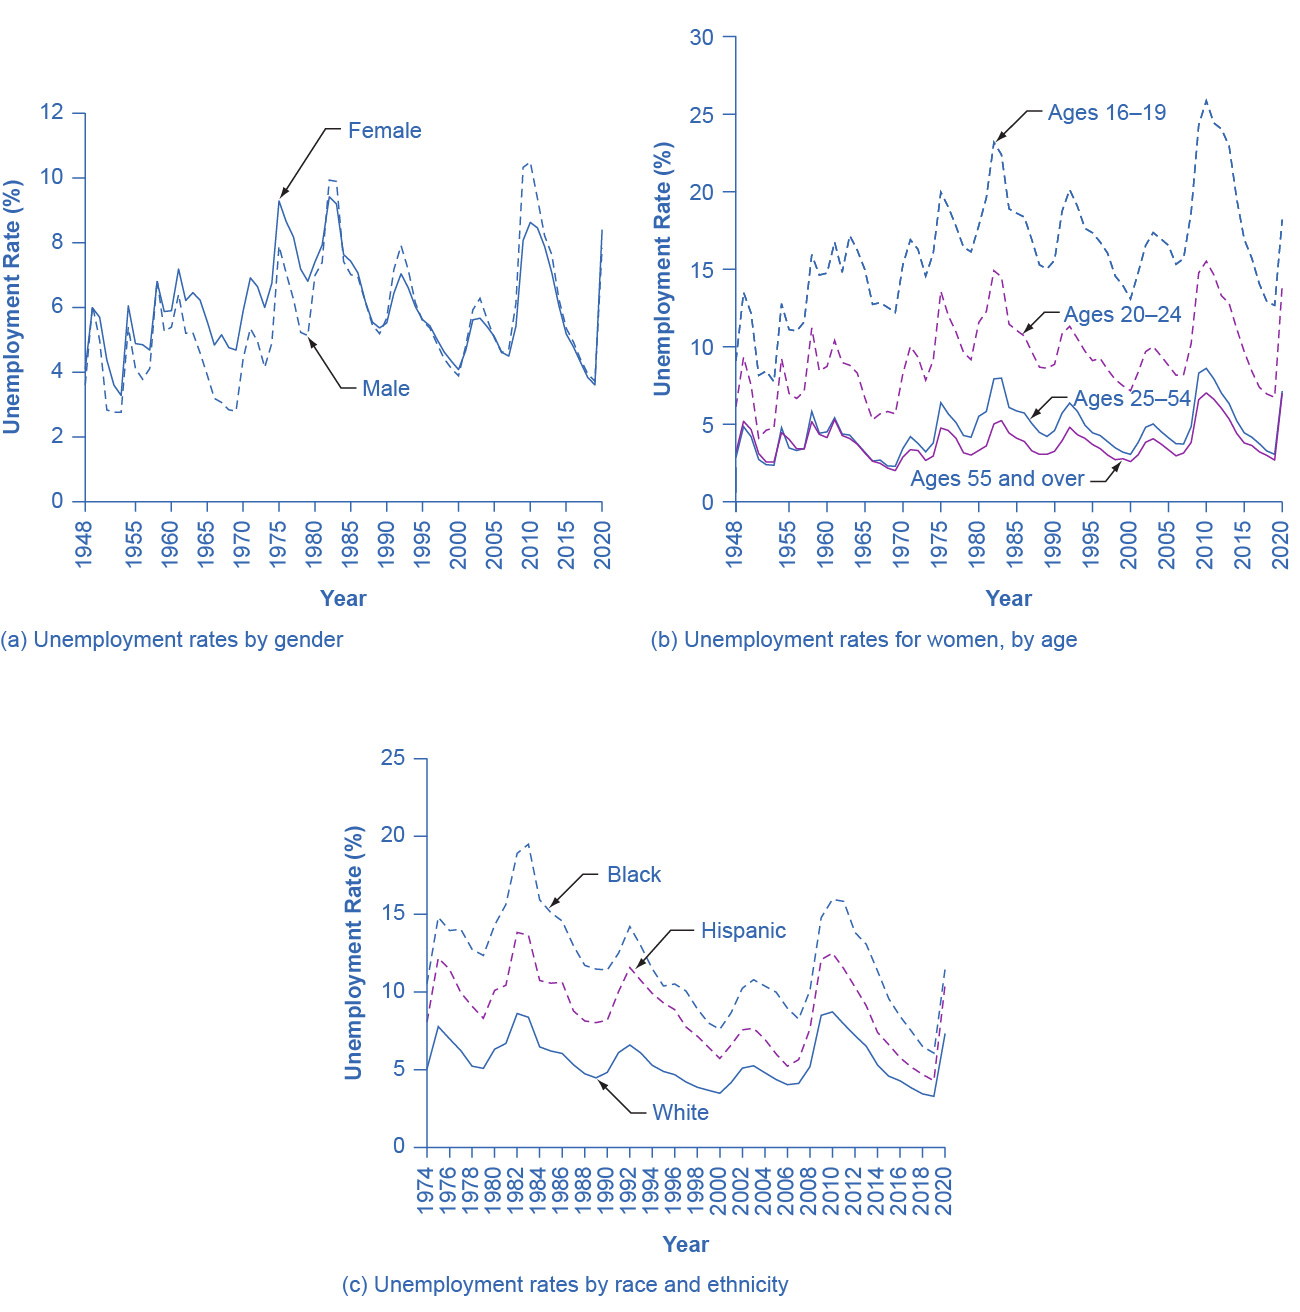


Figure 21.4図 21.4
(a) By gender, 1948–2020. Unemployment rates for men used to be lower than unemployment rates for women, but in recent decades, the two rates have been very close, often– and especially during and soon after the Great Recession – with the unemployment rate for men somewhat higher. (b) By age, 1948–2020. Unemployment rates are highest for the very young and become lower with age. (c) By race and ethnicity, 1974–2020. Although unemployment rates for all groups tend to rise and fall together, the unemployment rate for Black people is typically about twice as high as that for White people, while the unemployment rate for Hispanic people is in between. (Source: www.bls.gov)
英語のヒント
(a)性別、1948–2020年。以前は男性の失業率が女性より低かったが、ここ数十年は両者が非常に近く、しばしば、特に大不況の最中とその直後には、男性の失業率がやや高かった。(b)年齢別、1948–2020年。失業率は非常に若い人々で最も高く、年齢とともに低くなる。(c)人種・民族別、1974–2020年。どの集団の失業率も一緒に上下する傾向があるが、黒人の失業率は通常、白人の約2倍で、ヒスパニックの失業率はその中間にある。(出典:www.bls.gov)
The unemployment rate for women had historically tended to be higher than the unemployment rate for men, perhaps reflecting the historical pattern that women were seen as “secondary” earners. By about 1980, however, the unemployment rate for women was essentially the same as that for men, as Figure 21.4 (a) shows. During the pandemic-induced recession of 2020 and in the immediate aftermath, the unemployment rate for women exceeded the unemployment rate for men. Subsequently, however, the gap has narrowed.
英語のヒント
女性の失業率は、歴史的には男性より高い傾向があった。これは女性が「二次的な」稼ぎ手とみなされていた歴史的なパターンを反映しているのかもしれない。しかし図21.4(a)が示すように、1980年ごろには女性の失業率は男性とほぼ同じになった。パンデミックが引き起こした2020年の景気後退とその直後には、女性の失業率が男性を上回った。しかし、その後は差が縮まっている。
Additional Resources追加教材
Younger workers tend to have higher unemployment, while middle-aged workers tend to have lower unemployment. Younger workers move in and out of jobs more than middle-aged workers, as part of the process of matching of workers and jobs, and this contributes to their higher unemployment rates. In addition, middle-aged workers are more likely to feel the responsibility of needing to have a job more heavily. Elderly workers have extremely low rates of unemployment, because those who do not have jobs often exit the labor force by retiring, and thus are not counted in the unemployment statistics. Figure 21.4 (b) shows unemployment rates for women divided by age. The pattern for men is similar.
英語のヒント
若い労働者は失業率が高く、中年の労働者は失業率が低い傾向がある。若い労働者は、労働者と仕事を適合させる過程の一環として、中年の労働者より頻繁に仕事に就いたり離れたりする。これが若者の高い失業率に寄与している。また中年の労働者は、仕事を持たなければならない責任をより重く感じやすい。高齢労働者の失業率は極めて低い。仕事を持たない人は退職して労働力人口から退出することが多く、そのため失業統計に数えられないからである。図21.4(b)は、女性の失業率を年齢別に示す。男性も同様のパターンである。
The unemployment rate for African-Americans is substantially higher than the rate for other racial or ethnic groups, a fact that surely reflects, to some extent, a pattern of discrimination that has constrained Black people’s labor market opportunities. However, the gaps between unemployment rates for White, Black, and Hispanic people have diminished in the 1990s, as Figure 21.4 (c) shows. In fact, unemployment rates for Black and Hispanic people were at the lowest levels for several decades in the mid-2000s before rising during the recent Great Recession.
英語のヒント
アフリカ系米国人の失業率は、他の人種・民族集団よりかなり高い。この事実は、黒人の労働市場での機会を制限してきた差別のパターンを、ある程度は確かに反映している。しかし図21.4(c)が示すように、白人、黒人、ヒスパニックの失業率の差は、1990年代に縮まった。実際、黒人とヒスパニックの失業率は、直近の大不況で上昇する前の2000年代半ばには、数十年来の最低水準にあった。
Finally, those with less education typically suffer higher unemployment. In November 2021, for example, the unemployment rate for those with a college degree was 2.3%; for those with some college but not a four year degree, the unemployment rate was 3.7%; for high school graduates with no additional degree, the unemployment rate was 5.2%; and for those without a high school diploma, the unemployment rate was 5.7%. This pattern arises because additional education typically offers better connections to the labor market and higher demand. With less attractive labor market opportunities for low-skilled workers compared to the opportunities for the more highly-skilled, including lower pay, low-skilled workers may be less motivated to find jobs.
英語のヒント
最後に、教育水準の低い人は、通常、より高い失業率に苦しむ。たとえば2021年11月には、大学学位を持つ人の失業率は2.3%、大学教育をいくらか受けたが4年制大学の学位を持たない人は3.7%、それ以上の学位を持たない高校卒業者は5.2%、高校卒業資格のない人は5.7%だった。このパターンが生じるのは、追加の教育が通常、労働市場とのよりよい結びつきと、より高い需要をもたらすからである。低技能労働者の労働市場での機会は、高技能労働者と比べて、低賃金など魅力に乏しいため、低技能労働者は仕事を探す意欲が低くなることがある。