第29章為替相場と国際資金移動
Differences across Countries in Rates of Return国ごとの収益率の違い
The motivation for investment, whether domestic or foreign, is to earn a return. If rates of return in a country look relatively high, then that country will tend to attract funds from abroad. Conversely, if rates of return in a country look relatively low, then funds will tend to flee to other economies. Changes in the expected rate of return will shift demand and supply for a currency. For example, imagine that interest rates rise in the United States as compared with Mexico. Thus, financial investments in the United States promise a higher return than previously. As a result, more investors will demand U.S. dollars so that they can buy interest-bearing assets and fewer investors will be willing to supply U.S. dollars to foreign exchange markets. Demand for the U.S. dollar will shift to the right, from D0 to D1, and supply will shift to the left, from S0 to S1, as Figure 29.7 shows. The new equilibrium (E1), will occur at an exchange rate of nine pesos/dollar and the same quantity of $8.5 billion. Thus, a higher interest rate or rate of return relative to other countries leads a nation’s currency to appreciate or strengthen, and a lower interest rate relative to other countries leads a nation’s currency to depreciate or weaken. Since a nation’s central bank can use monetary policy to affect its interest rates, a central bank can also cause changes in exchange rates—a connection that we will discuss in more detail later in this chapter.
英語のヒント
国内であれ海外であれ、投資の動機は収益を得ることである。ある国の収益率が相対的に高く見えるなら、その国は海外から資金を引きつける傾向がある。逆に、ある国の収益率が相対的に低く見えるなら、資金はほかの経済へ逃れる傾向がある。予想収益率の変化は、通貨の需要と供給を移動させる。たとえば、メキシコに比べてアメリカの金利が上がったと想像しよう。アメリカでの金融投資は、以前より高い収益を見込める。その結果、利息を生む資産を買うために米ドルを需要する投資家が増え、外国為替市場に米ドルを供給しようとする投資家は減る。図29.7のように、米ドルの需要はD0からD1へ右に、供給はS0からS1へ左に移動する。新しい均衡(E1)は、1ドル当たり9ペソの為替レートと、同じ85億ドルの数量のところに生じる。したがって、他国に比べて高い金利や収益率は、その国の通貨を増価、つまり強め、他国に比べて低い金利は、その国の通貨を減価、つまり弱める。その国の中央銀行は金融政策で金利に影響を与えられるので、為替レートも変化させられる。このつながりは、この章の後半で詳しく論じる。
Exchange Rate Market for U.S. Dollars Reacts to Higher Interest Rates金利上昇に反応する米ドルの為替市場
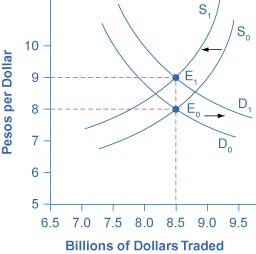
Figure 29.7図 29.7
A higher rate of return for U.S. dollars makes holding dollars more attractive. Thus, the demand for dollars in the foreign exchange market shifts to the right, from D0 to D1, while the supply of dollars shifts to the left, from S0 to S1. The new equilibrium (E1) has a stronger exchange rate than the original equilibrium (E0), but in this example, the equilibrium quantity traded does not change.
英語のヒント
米ドルの収益率が高まると、ドルを持つ魅力が増す。そのため、外国為替市場でのドル需要はD0からD1へ右に移動し、ドル供給はS0からS1へ左に移動する。新しい均衡(E1)の為替レートは、もとの均衡(E0)より強いが、この例では均衡取引量は変わらない。
Relative Inflation相対的なインフレ
If a country experiences a relatively high inflation rate compared with other economies, then the buying power of its currency is eroding, which will tend to discourage anyone from wanting to acquire or to hold the currency. Figure 29.8 shows an example based on an actual episode concerning the Mexican peso. In 1986–87, Mexico experienced an inflation rate of over 200%. Not surprisingly, as inflation dramatically decreased the peso's purchasing power in Mexico. The peso's exchange rate value declined as well. Figure 29.8 shows that the demand for the peso on foreign exchange markets decreased from D0 to D1, while the peso's supply increased from S0 to S1. The equilibrium exchange rate fell from $2.50 per peso at the original equilibrium (E0) to $0.50 per peso at the new equilibrium (E1). In this example, the quantity of pesos traded on foreign exchange markets remained the same, even as the exchange rate shifted.
英語のヒント
ある国がほかの経済に比べて相対的に高いインフレ率を経験すると、その通貨の購買力は失われていく。そのため、誰であれ、その通貨を取得したり保有したりしたいという気持ちを弱められる傾向がある。図29.8は、メキシコ・ペソに関する実際の出来事に基づく例を示す。1986~1987年に、メキシコは200%超のインフレ率を経験した。インフレがメキシコでのペソの購買力を劇的に低下させたのだから、不思議はない。ペソの為替価値も低下した。図29.8では、外国為替市場のペソ需要がD0からD1へ減少し、ペソ供給はS0からS1へ増加している。均衡為替レートは、もとの均衡(E0)の1ペソ当たり2.50ドルから、新しい均衡(E1)の1ペソ当たり0.50ドルへ下がった。この例では、為替レートは動いたが、外国為替市場で取引されるペソの量は変わらなかった。
Exchange Rate Markets React to Higher Inflationインフレ上昇に反応する為替市場
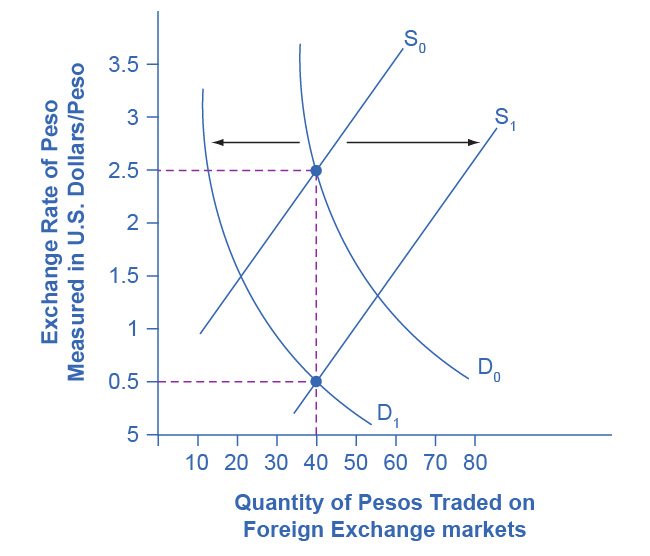


Figure 29.8図 29.8
If a currency is experiencing relatively high inflation, then its buying power is decreasing and international investors will be less eager to hold it. Thus, a rise in inflation in the Mexican peso would lead demand to shift from D0 to D1, and supply to increase from S0 to S1. Both movements in demand and supply would cause the currency to depreciate. Here, we draw no effect on the quantity traded, but in truth it could be an increase or a decrease, depending on the actual movements of demand and supply.
英語のヒント
ある通貨で相対的に高いインフレが起きていれば、その購買力は低下し、国際投資家はその保有に消極的になる。そのため、メキシコ・ペソのインフレ上昇は、需要をD0からD1へ移動させ、供給をS0からS1へ増やす。需要と供給のどちらの動きも、その通貨を減価させる。ここでは取引量への影響がないように描くが、実際には、需要と供給の具体的な動きに応じて、増えることも減ることもある。
Additional Resources追加教材
Purchasing Power Parity購買力平価
Over the long term, exchange rates must bear some relationship to the currency's buying power in terms of internationally traded goods. If at a certain exchange rate it was much cheaper to buy internationally traded goods—such as oil, steel, computers, and cars—in one country than in another country, businesses would start buying in the cheap country, selling in other countries, and pocketing the profits.
英語のヒント
長期には、為替レートは、国際的に取引される財についての通貨の購買力と、何らかの関係を持たなければならない。ある為替レートで、石油、鉄鋼、コンピューター、自動車などの国際取引される財を、ある国では他国よりもはるかに安く買えるなら、企業は安い国で買い、ほかの国で売って、その利益を手にするようになるだろう。
For example, if a U.S. dollar is worth $1.30 in Canadian currency, then a car that sells for $20,000 in the United States should sell for $26,000 in Canada. If the price of cars in Canada were much lower than $26,000, then at least some U.S. car-buyers would convert their U.S. dollars to Canadian dollars and buy their cars in Canada. If the price of cars were much higher than $26,000 in this example, then at least some Canadian buyers would convert their Canadian dollars to U.S. dollars and go to the United States to purchase their cars. This is known as arbitrage, the process of buying and selling goods or currencies across international borders at a profit. It may occur slowly, but over time, it will force prices and exchange rates to align so that the price of internationally traded goods is similar in all countries.
英語のヒント
たとえば、1米ドルが1.30カナダ・ドルに相当するなら、アメリカで20,000ドルで売られる自動車は、カナダでは26,000ドルで売られるはずである。カナダの自動車価格が26,000ドルよりはるかに低ければ、少なくとも一部のアメリカの自動車購入者は、米ドルをカナダ・ドルに換え、カナダで車を買うだろう。この例で、自動車価格が26,000ドルよりはるかに高ければ、少なくとも一部のカナダの購入者は、カナダ・ドルを米ドルに換え、アメリカへ行って車を買うだろう。これを裁定取引という。国境を越えて財や通貨を売買し、利益を得る過程である。ゆっくり進む場合もあるが、時間とともに、国際取引される財の価格がどの国でも同程度になるよう、価格と為替レートを整合させる。
We call the exchange rate that equalizes the prices of internationally traded goods across countries the purchasing power parity (PPP) exchange rate. A group of economists at the International Comparison Program, run by the World Bank, have calculated the PPP exchange rate for all countries, based on detailed studies of the prices and quantities of internationally tradable goods.
英語のヒント
国際的に取引される財の価格を国々の間で等しくする為替レートを、購買力平価(PPP)為替レートという。世界銀行が運営する国際比較プログラムの経済学者たちは、国際的に取引可能な財の価格と数量の詳細な調査に基づき、すべての国のPPP為替レートを計算している。
The purchasing power parity exchange rate has two functions. First, economists often use PPP exchange rates for international comparison of GDP and other economic statistics. Imagine that you are preparing a table showing the size of GDP in many countries in several recent years, and for ease of comparison, you are converting all the values into U.S. dollars. When you insert the value for Japan, you need to use a yen/dollar exchange rate. However, should you use the market exchange rate or the PPP exchange rate? Market exchange rates bounce around. In 2014, the exchange rate was 105 yen/dollar, but in late 2015 the U.S. dollar exchange rate versus the yen was 121 yen/dollar. For simplicity, say that Japan’s GDP was ¥500 trillion in both 2014 and 2015. If you use the market exchange rates, then Japan’s GDP will be $4.8 trillion in 2014 (that is, ¥500 trillion /(¥105/dollar)) and $4.1 trillion in 2015 (that is, ¥500 trillion /(¥121/dollar)).
英語のヒント
購買力平価為替レートには、二つの役割がある。第一に、経済学者はGDPやほかの経済統計を国際比較するために、PPP為替レートをよく使う。近年の数年間について、多くの国のGDP規模を示す表を作り、比較しやすいよう、すべての値を米ドルへ換算すると想像しよう。日本の値を記入するには、円/ドル為替レートを使う必要がある。しかし、市場為替レートとPPP為替レートのどちらを使うべきだろうか。市場為替レートは上下する。2014年の為替レートは1ドル当たり105円だったが、2015年末には、円に対する米ドル為替レートは1ドル当たり121円だった。単純化のため、日本のGDPが2014年も2015年も500兆円だったとしよう。市場為替レートを使うと、日本のGDPは2014年には4.8兆ドル、つまり500兆円÷(1ドル当たり105円)、2015年には4.1兆ドル、つまり500兆円÷(1ドル当たり121円)になる。
The misleading appearance of a changing Japanese economy occurs only because we used the market exchange rate, which often has short-run rises and falls. However, PPP exchange rates stay fairly constant and change only modestly, if at all, from year to year.
英語のヒント
日本経済が変化しているように誤って見えるのは、短期にしばしば上下する市場為替レートを使ったためにすぎない。一方、PPP為替レートはかなり一定に保たれ、年ごとの変化があったとしても穏やかである。
The second function of PPP is that exchanges rates will often get closer to it as time passes. It is true that in the short and medium run, as exchange rates adjust to relative inflation rates, rates of return, and to expectations about how interest rates and inflation will shift, the exchange rates will often move away from the PPP exchange rate for a time. However, knowing the PPP will allow you to track and predict exchange rate relationships.
英語のヒント
PPPの第二の役割は、時間とともに、為替レートがそれに近づくことが多いという点にある。確かに短中期には、為替レートは相対的なインフレ率、収益率、金利やインフレがどう動くかという予想に調整するため、一時的にPPP為替レートから離れることが多い。しかし、PPPを知ることで、為替レートの関係を追跡し、予測できる。