第22章インフレーション
22.3 How the U.S. and Other Countries Experience Inflation22.3 米国とその他の国々のインフレ経験
Learning Objectives学習目標
Learning Objectives学習目標
By the end of this section, you will be able to:
英語のヒント
この節を学ぶと、次のことができるようになる。
- Identify patterns of inflation for the United States using data from the Consumer Price Index
英語のヒント
消費者物価指数のデータを使って、米国のインフレのパターンを特定する - Identify patterns of inflation on an international level
英語のヒント
国際的なインフレのパターンを特定する
In the last three decades, inflation has been relatively low in the U.S. economy, with the Consumer Price Index typically rising 2% to 4% per year. Looking back over the twentieth century, there have been several periods where inflation caused the price level to rise at double-digit rates, but nothing has come close to hyperinflation.
英語のヒント
過去30年間、米国経済のインフレは比較的低く、消費者物価指数は通常、年2~4%上昇してきた。20世紀を振り返ると、インフレによって物価水準が2桁の率で上がった時期が何度かあったが、ハイパーインフレに近づいたことはない。
Historical Inflation in the U.S. Economy米国経済のインフレの歴史
Figure 22.3 (a) shows the level of prices in the Consumer Price Index stretching back to 1913. In this case, the base years (when the CPI is defined as 100) are set for the average level of prices that existed from 1982 to 1984. Figure 22.3 (b) shows the annual percentage changes in the CPI over time, which is the inflation rate.
英語のヒント
U.S. Price Level and Inflation Rates since 19471947年以降の米国の物価水準とインフレ率
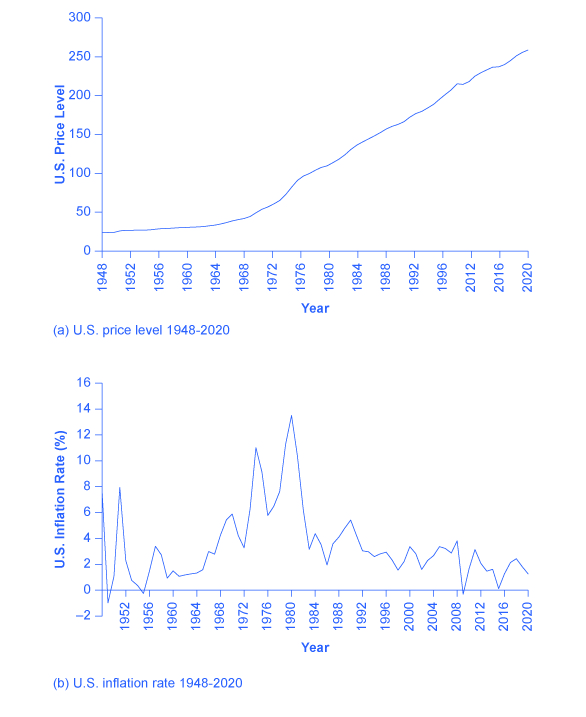
Figure 22.3図 22.3
Graph a shows the trends in the U.S. price level from the year 1947 to 2020. In 1947, the graph starts out close to 22. It gradually increases until about 1973, then increases more rapidly through the remainder of the 1970s and beyond, with periodic dips, until 2020, when it reached around 260. Graph b shows the trends in U.S. inflation rates from the year 1948 to 2020. In 1948, the graph starts out with inflation at almost 7%, goes up and down periodically, with peaks in the 1940s and the 1970s, until settling to around 1.2% in 2020.
英語のヒント
グラフaは、1947~2020年の米国の物価水準の推移を示す。1947年は22近くから始まる。1973年ごろまで緩やかに上がり、その後1970年代の残りとそれ以降はより急速に上昇する。ときどき低下しながら、2020年には約260に達する。グラフbは、1948~2020年の米国のインフレ率の推移を示す。1948年はほぼ7%で始まり、1940年代と1970年代にピークを迎えつつ周期的に上下し、2020年には約1.2%に落ち着く。
Inflation as measured by the consumer price index reflects the annual percentage change in the cost to the average consumer of acquiring a basket of goods and services that may be fixed or changed at specified intervals, such as yearly.
英語のヒント
消費者物価指数で測ったインフレは、平均的な消費者が財・サービスのバスケットを取得する費用の年間変化率を表す。バスケットは固定される場合も、毎年など一定の間隔で変更される場合もある。
The first two waves of inflation are easy to characterize in historical terms: they are right after World War I and World War II. However, there are also two periods of severe negative inflation—called deflation—in the early decades of the twentieth century: one following the deep 1920-21 recession and the other during the Great Depression of the 1930s. (Since inflation is a time when the buying power of money in terms of goods and services is reduced, deflation will be a time when the buying power of money in terms of goods and services increases.) For the period from 1900 to about 1960, the major inflations and deflations nearly balanced each other out, so the average annual rate of inflation over these years was only about 1% per year. A third wave of more severe inflation arrived in the 1970s and departed in the early 1980s.
英語のヒント
最初の二つのインフレの波は、歴史的には容易に特徴づけられる。第一次世界大戦直後と第二次世界大戦直後である。しかし20世紀前半には、デフレと呼ばれる激しいマイナスのインフレも二度あった。一つは1920~1921年の深い景気後退の後、もう一つは1930年代の大恐慌期である。(インフレが財・サービスに対する貨幣の購買力の低下する時期なら、デフレは購買力の上がる時期である。)1900年から1960年ごろまでは、大きなインフレとデフレがほぼ相殺し合い、この間の年平均インフレ率は約1%にすぎなかった。第3の、より激しいインフレの波は1970年代に訪れ、1980年代初めに去った。
Additional Resources追加教材
Times of recession or depression often seem to be times when the inflation rate is lower, as in the recession of 1920–1921, the Great Depression, the recession of 1980–1982, and the Great Recession in 2008–2009. There were a few months in 2009 that were deflationary, but not at an annual rate. High levels of unemployment typically accompany recessions, and the total demand for goods falls, pulling the price level down. Conversely, the rate of inflation often, but not always, seems to start moving up when the economy is growing very strongly, like right after wartime or during the 1960s. The frameworks for macroeconomic analysis, that we developed in other chapters, will explain why recession often accompanies higher unemployment and lower inflation, while rapid economic growth often brings lower unemployment but higher inflation.
英語のヒント
1920~1921年の景気後退、大恐慌、1980~1982年の景気後退、2008~2009年の大不況のように、景気後退や不況の時期は、しばしばインフレ率が低い時期でもある。2009年にはデフレの月がいくつかあったが、年率ではそうではなかった。景気後退には通常、高い失業率が伴い、財の総需要が減って、物価水準を引き下げる。逆に、戦争直後や1960年代のように、経済が非常に力強く成長しているとき、必ずではないが、インフレ率はしばしば上がり始めるようにみえる。他の章で展開したマクロ経済分析の枠組みは、景気後退が高失業と低インフレを伴うことが多い一方、急速な経済成長が低失業と高インフレをもたらすことが多い理由を説明する。
Inflation around the World世界のインフレ
Around the rest of the world, the pattern of inflation has been very mixed; Figure 22.4 shows inflation rates over the last several decades. Many industrialized countries, not just the United States, had relatively high inflation rates in the 1970s. For example, in 1975, Japan’s inflation rate was over 8% and the inflation rate for the United Kingdom was almost 25%. In the 1980s, inflation rates came down in the United States and in Europe and have largely stayed down.
英語のヒント
世界のその他の地域では、インフレのパターンは非常にさまざまだった。図22.4は過去数十年のインフレ率を示す。米国だけでなく、多くの工業国が1970年代には比較的高いインフレ率を経験した。たとえば1975年、日本のインフレ率は8%を超え、英国はほぼ25%だった。1980年代には米国と欧州でインフレ率が下がり、その後もおおむね低いままだった。
Countries with Relatively Low Inflation Rates, 1961–2020比較的インフレ率の低い国々、1961–2020年
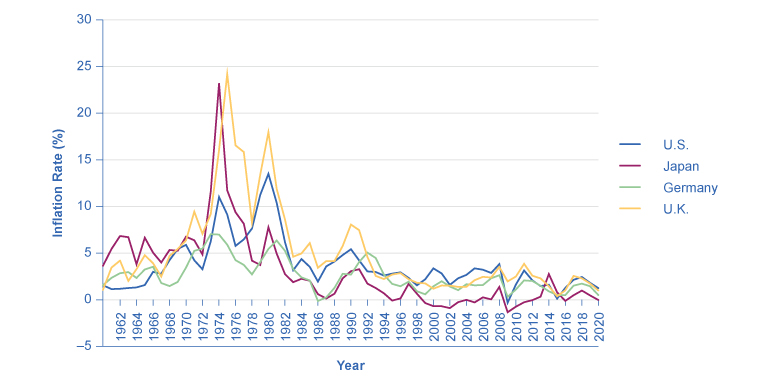
Figure 22.4図 22.4
This chart shows the annual percentage change in consumer prices compared with the previous year’s consumer prices in the United States, the United Kingdom, Japan, and Germany.
英語のヒント
この図は、米国、英国、日本、ドイツについて、消費者物価の前年に対する年間変化率を示す。
Countries with controlled economies in the 1970s, like the Soviet Union and China, historically had very low rates of measured inflation—because prices were forbidden to rise by law, except for the cases where the government deemed a price increase to be due to quality improvements. However, these countries also had perpetual shortages of goods, since forbidding prices to rise acts like a price ceiling and creates a situation where quantity demanded often exceeds quantity supplied. As Russia and China made a transition toward more market-oriented economies, they also experienced outbursts of inflation, although we should regard the statistics for these economies as somewhat shakier. Inflation in China averaged about 10% per year for much of the 1980s and early 1990s, although it has dropped off since then. Russia experienced hyperinflation—an outburst of high inflation—of 2,500% per year in the early 1990s, although by 2006 Russia’s consumer price inflation had dipped below 10% per year, as Figure 22.5 shows. The closest the United States has ever reached hyperinflation was during the 1860–1865 Civil War, in the Confederate states.
英語のヒント
1970年代に統制経済だったソ連や中国などの国々は、歴史的に、測定されたインフレ率が非常に低かった。品質改善による値上がりと政府が認める場合を除き、法律で価格上昇が禁止されていたからである。しかし、これらの国々では財の不足も絶えなかった。価格上昇の禁止は上限価格として働き、需要量がしばしば供給量を上回る状況をつくるからである。ロシアと中国が市場志向の経済へ移行すると、インフレの急発生も経験した。ただし、これらの経済の統計は、やや信頼性が低いものとして扱うべきである。中国のインフレ率は1980年代と1990年代初めの多くの期間、年平均約10%だったが、その後下がった。ロシアは1990年代初めに年2500%という高インフレの急発生、すなわちハイパーインフレを経験した。しかし図22.5が示すように、2006年までに消費者物価のインフレ率は年10%未満に下がった。米国がハイパーインフレに最も近づいたのは、1860~1865年の南北戦争中の南部連合諸州である。
Countries with Relatively High Inflation Rates, 1981–2020比較的インフレ率の高い国々、1981–2020年
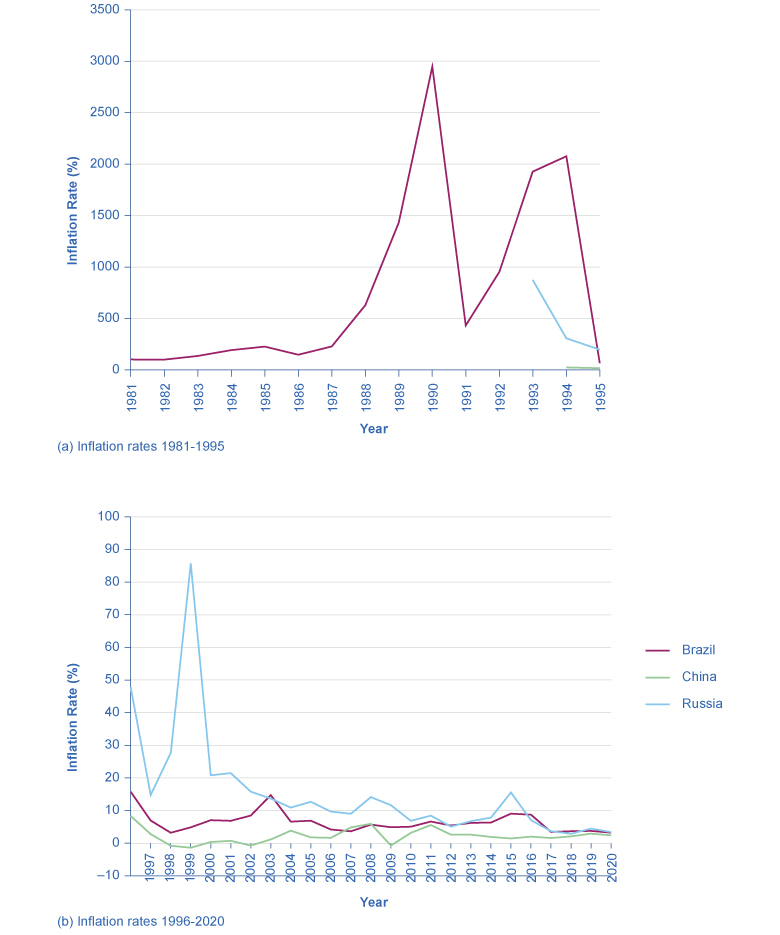


Figure 22.5図 22.5
These charts show the percentage change in consumer prices compared with the previous year’s consumer prices in Brazil, China, and Russia. (a) Of these, Brazil and Russia experienced very high inflation at some point between the late-1980s and late-1990s. (b) Though not as high, China also had high inflation rates in the mid-1990s. Even though their inflation rates have come down over the last two decades, several of these countries continue to see significant inflation rates. (Sources: http://www.inflation.eu/inflation-rates; http://research.stlouisfed.org/fred2/series/FPCPITOTLZGBRA; http://research.stlouisfed.org/fred2/series/CHNCPIALLMINMEI; http://research.stlouisfed.org/fred2/series/FPCPITOTLZGRUS)
英語のヒント
これらの図は、ブラジル、中国、ロシアの消費者物価の前年に対する変化率を示す。(a)このうちブラジルとロシアは、1980年代後半から1990年代後半の間のある時点で、非常に高いインフレを経験した。(b)それほど高くはないものの、中国も1990年代半ばに高いインフレ率を経験した。過去20年間にインフレ率は下がったが、これらの国々の一部では依然として大きなインフレ率が続いている。(出典:http://www.inflation.eu/inflation-rates; http://research.stlouisfed.org/fred2/series/FPCPITOTLZGBRA; http://research.stlouisfed.org/fred2/series/CHNCPIALLMINMEI; http://research.stlouisfed.org/fred2/series/FPCPITOTLZGRUS)
Many countries in Latin America experienced raging inflation during the 1980s and early 1990s, with inflation rates often well above 100% per year. In 1990, for example, both Brazil and Argentina saw inflation climb above 2000%. Certain countries in Africa experienced extremely high rates of inflation, sometimes bordering on hyperinflation, in the 1990s. Nigeria, the most populous country in Africa, had an inflation rate of 75% in 1995.
英語のヒント
ラテンアメリカの多くの国々は、1980年代から1990年代初めに激しいインフレを経験し、インフレ率はしばしば年100%を大きく超えた。たとえば1990年には、ブラジルもアルゼンチンも2000%を超えた。アフリカの一部の国々は1990年代に、時にはハイパーインフレに近い、極めて高いインフレ率を経験した。アフリカで最も人口の多いナイジェリアの1995年のインフレ率は75%だった。
In the early 2000s, the problem of inflation appears to have diminished for most countries, at least in comparison to the worst times of recent decades. As we noted in this earlier Bring it Home feature, in recent years, the world’s worst example of hyperinflation was in Zimbabwe, where at one point the government was issuing bills with a face value of $100 trillion (in Zimbabwean dollars)—that is, the bills had $100,000,000,000,000 written on the front, but were almost worthless. In many countries, the memory of double-digit, triple-digit, and even quadruple-digit inflation is not very far in the past.
英語のヒント
2000年代初めには、少なくとも近年の最悪の時期と比べ、多くの国でインフレの問題は小さくなったようにみえる。前の「身近に考える」で述べたように、近年の世界最悪のハイパーインフレの例はジンバブエだった。政府はある時点で、額面100兆ジンバブエ・ドルの紙幣を発行していた。紙幣の表には$100,000,000,000,000と書かれていたが、ほとんど価値はなかった。多くの国にとって、2桁、3桁、さらには4桁のインフレの記憶は、それほど遠い過去ではない。