第20章経済成長
Measuring Productivity生産性の測定
An economy’s rate of productivity growth is closely linked to the growth rate of its GDP per capita, although the two are not identical. For example, if the percentage of the population who holds jobs in an economy increases, GDP per capita will increase but the productivity of individual workers may not be affected. Over the long term, the only way that GDP per capita can grow continually is if the productivity of the average worker rises or if there are complementary increases in capital.
英語のヒント
一国の生産性上昇率は、一人当たりGDPの成長率と密接に結び付いているが、両者は同一ではない。例えば人口に占める就業者の割合が増えれば、一人当たりGDPは増えるが、個々の労働者の生産性は変わらないかもしれない。長期にわたって一人当たりGDPが継続的に増えるには、平均的な労働者の生産性が上がるか、補完的な資本の増加が起こるしかない。
A common measure of U.S. productivity per worker is dollar value per hour the worker contributes to the employer’s output. This measure excludes government workers, because their output is not sold in the market and so their productivity is hard to measure. It also excludes farming, which accounts for only a relatively small share of the U.S. economy. Figure 20.3 shows an index of output per hour, with 2012 as the base year (when the index equals 100). The index equaled 110.5 in 2020. In 1977, the index equaled about 50, which shows that workers have more than doubled their productivity since then.
英語のヒント
米国でよく使われる労働者の生産性の指標は、その労働者が一時間当たりに雇用主の産出へ貢献するドル価値である。政府職員の産出は市場で販売されず、生産性を測りにくいため、この指標からは除く。米国経済に占める割合が比較的小さい農業も除外する。図20.3は、2012年を指数100の基準年とする一時間当たり産出の指数を示している。2020年の指数は110.5だった。1977年は約50であり、労働者の生産性がそれ以来2倍以上になったことを示す。
Output per Hour Worked in the U.S. Economy, 1947–2020米国経済の労働一時間当たり産出、1947~2020年
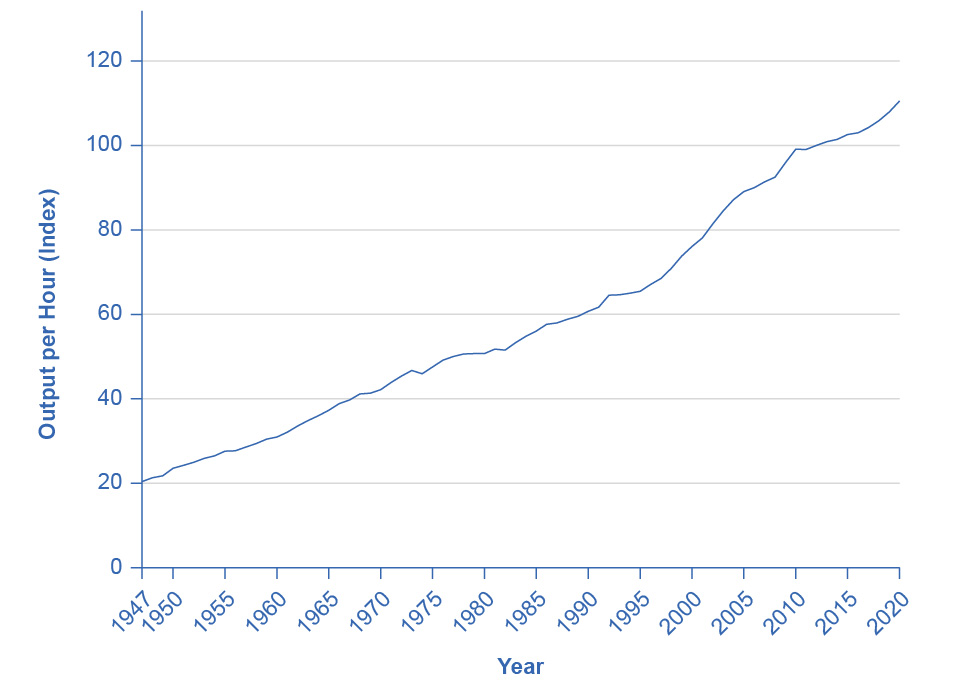
Figure 20.3図 20.3
Output per hour worked is a measure of worker productivity. In the U.S. economy, worker productivity rose more quickly in the 1960s and the mid-1990s compared with the 1970s and 1980s. However, these growth-rate differences are only a few percentage points per year. Look carefully to see them in the changing slope of the line. The average U.S. worker produced over twice as much per hour in 2020 than they did in the 1970s. (Source: U.S. Department of Labor, Bureau of Labor Statistics.)
英語のヒント
労働一時間当たり産出は労働生産性の尺度である。米国経済の労働生産性は、1970年代と1980年代より、1960年代と1990年代半ばに速く上昇した。しかし、成長率の差は年数パーセントポイントにすぎない。線の傾きの変化を注意深く見て確認しよう。2020年の米国の平均的な労働者は、1970年代の2倍以上を一時間に生産した。(出典:米国労働省・労働統計局)
A graph has an X-axis with years progressing from 1955 to 2020 and a Y axis labeled Percent Change at Annual Rate. The graphed data moves up and down across a zero line indicating change year over year. In 1970, 1974, 1981, 1983, 2008, and 2020, the rate was quite low, as the U.S. was undergoing recessions.
英語のヒント
横軸が1955年から2020年までの年、縦軸が「年率での変化率(%)」のグラフ。データはゼロの線を挟んで上下し、前年比の変化を示す。1970年、1974年、1981年、1983年、2008年、2020年は、米国が景気後退の最中だったため、率がかなり低かった。
According to the Department of Labor, U.S. productivity growth was fairly strong in the 1950s but then declined in the 1970s and 1980s before rising again in the second half of the 1990s and the first half of the 2000s. In fact, the rate of productivity measured by the change in output per hour worked averaged 2.8% per year from 1947 to 1973; dropped to 1.2% per year from 1973 to 1979; increased to 1.5% per year from 1979 to 1990; increased again to 2.2% from 1990 to 2000; increased even more to 2.7% from 2000 to 2007; and then decreased to 1.4% from 2007 to 2020 Figure 20.4 shows average annual rates of productivity growth averaged over time since 1947.
英語のヒント
労働省によると、米国の生産性の伸びは1950年代にはかなり強かったが、1970年代と1980年代に低下し、1990年代後半と2000年代前半に再び上昇した。実際に、労働一時間当たり産出の変化で測る生産性上昇率は、1947~1973年に平均年2.8%だった。1973~1979年には年1.2%へ下がり、1979~1990年には年1.5%へ、1990~2000年には2.2%へ、2000~2007年にはさらに2.7%へ上がった。その後、2007~2020年には1.4%へ下がった。図20.4は、1947年以来の各期間の平均年間生産性上昇率を示している。
Productivity Growth Since 19471947年以降の生産性上昇
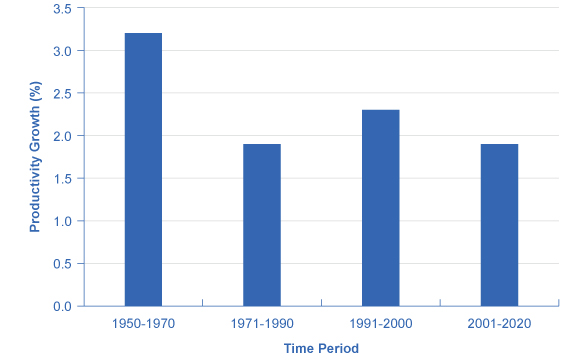


Figure 20.4図 20.4
U.S. growth in worker productivity was very high between 1947 and 1973. It then declined to lower levels in the later 1970s and the 1980s. The late 1990s and early 2000s saw productivity rebound, but then productivity sagged a bit between 2001 and 2020. Some think the productivity rebound of the late 1990s and early 2000s marks the start of a “new economy” built on higher productivity growth, but we cannot determine this until more time has passed. (Source: U.S. Department of Labor, Bureau of Labor Statistics.)
英語のヒント
米国の労働生産性上昇率は、1947~1973年に非常に高かった。その後、1970年代後半と1980年代には低い水準へ下がった。1990年代後半と2000年代初頭には持ち直したが、2001~2020年には再びやや弱まった。1990年代後半と2000年代初頭の回復が、より高い生産性上昇率に基づく「ニューエコノミー」の始まりを示すと考える人もいるが、もっと時間がたつまで判断はできない。(出典:米国労働省・労働統計局)
The “New Economy” Controversy「ニューエコノミー」をめぐる論争
In recent years a controversy has been brewing among economists about the resurgence of U.S. productivity in the second half of the 1990s. One school of thought argues that the United States had developed a “new economy” based on the extraordinary advances in communications and information technology of the 1990s. The most optimistic proponents argue that it would generate higher average productivity growth for decades to come. The pessimists, alternatively, argue that even five or ten years of stronger productivity growth does not prove that higher productivity will last for the long term. It is hard to infer anything about long-term productivity trends during the later part of the 2000s, because the steep 2008-2009 recession, with its sharp but not completely synchronized declines in output and employment, complicates any interpretation. While productivity growth was high in 2009 and 2010 (around 3%), it has slowed down over the last decade.
英語のヒント
近年、1990年代後半の米国の生産性回復をめぐって、経済学者の間で論争が起きている。一つの立場は、1990年代の通信・情報技術の並外れた進歩を基盤に、米国が「ニューエコノミー」を築いたと主張する。最も楽観的な支持者は、それが今後何十年にもわたり平均生産性上昇率を高めると考える。対して悲観的な人々は、生産性の強い伸びが5年や10年続いても、それが長期的に持続する証明にはならないと主張する。2000年代後半の長期的な生産性の傾向について、何かを推測するのは難しい。2008~2009年の急激な景気後退では、産出と雇用がともに急減したものの、完全に同時ではなかったため、解釈が複雑になるからである。2009年と2010年には生産性上昇率が約3%と高かったが、過去10年間には鈍化している。
Productivity growth is also closely linked to the average level of wages. Over time, the amount that firms are willing to pay workers will depend on the value of the output those workers produce. If a few employers tried to pay their workers less than what those workers produced, then those workers would receive offers of higher wages from other profit-seeking employers. If a few employers mistakenly paid their workers more than what those workers produced, those employers would soon end up with losses. In the long run, productivity per hour is the most important determinant of the average wage level in any economy. To learn how to compare economies in this regard, follow the steps in the following Work It Out feature.
英語のヒント
生産性の上昇は、平均賃金水準とも密接に結び付いている。長い目で見ると、企業が労働者に支払おうとする額は、その労働者が生み出す産出の価値による。一部の雇用主が労働者の生産価値より低い賃金を払おうとすれば、労働者は利潤を求める他の雇用主から、より高い賃金の申し出を受けるだろう。一部の雇用主が誤って生産価値より高い賃金を払えば、まもなく損失を抱えることになる。長期には、どの経済でも一時間当たり生産性が平均賃金水準の最も重要な決定要因である。この観点で経済どうしを比較する方法を学ぶため、次の「計算してみよう」の手順をたどろう。