第17章金融市場
Stocks株式
As we stated earlier, the rate of return on a financial investment in a share of stock can come in two forms: as dividends paid by the firm and as a capital gain achieved by selling the stock for more than you paid. The range of possible returns from buying stock is mind-bending. Firms can decide to pay dividends or not. A stock price can rise to a multiple of its original price or sink all the way to zero. Even in short periods of time, well-established companies can see large movements in their stock prices. For example, on July 1, 2011, Netflix stock peaked at $295 per share; one year later, on July 30, 2012, it was at $53.91 per share; in 2022, it had recovered to $199. When Facebook went public, its shares of stock sold for around $40 per share, but in 2022, they were selling for slightly over $212.
英語のヒント
先に述べたように、株式への金融投資の収益には、企業が払う配当と、購入価格より高く売ることによるキャピタルゲインの二つの形がある。株式購入で起こりうる収益の幅は、想像を絶する。企業は配当を払うことも払わないことも選べる。株価は元の何倍にもなる一方、ゼロまで下がることもある。定評のある企業でも、短期間に株価が大きく動くことがある。たとえばNetflix株は2011年7月1日に295ドルのピークを付け、1年後の2012年7月30日には53.91ドルになり、2022年には199ドルに回復していた。Facebookが上場したときは約40ドルだったが、2022年には212ドルを少し超える価格で取引されていた。
We will discuss the reasons why stock prices fall and rise so abruptly below, but first you need to know how we measure stock market performance. There are a number of different ways to measure the overall performance of the stock market, based on averaging different subsets of companies' stock prices. Perhaps the best-known stock market measure is the Dow Jones Industrial Average, which is based on 30 large U.S. companies' stock prices. Another stock market performance gauge, the Standard & Poor’s 500, follows the stock prices of the 500 largest U.S. companies. The Wilshire 5000 tracks the stock prices of essentially all U.S. companies that have stock the public can buy and sell.
英語のヒント
株価が急に上下する理由は後で論じるが、まず株式市場の実績をどう測るかを知る必要がある。異なる企業群の株価を平均して、市場全体の実績を測る方法はいくつもある。おそらく最も有名なのは、米国の大企業30社の株価に基づくダウ・ジョーンズ工業株平均である。別の指標であるS&P 500は、米国の最大級の500社の株価を追う。ウィルシャー5000は、一般の人が売買できる株式を持つ米国のほぼ全企業の株価を追跡する。
Other stock market measures focus on where stocks are traded. For example, the New York Stock Exchange monitors the performance of stocks that are traded on that exchange in New York City. The Nasdaq stock market includes about 3,600 stocks, with a concentration of technology stocks. Table 17.1 lists some of the most commonly cited measures of U.S. and international stock markets.
英語のヒント
ほかの指標は株式が取引される場所に注目する。たとえばニューヨーク証券取引所は、ニューヨーク市の同取引所で売買される株式の実績を監視する。ナスダック市場は、技術関連を中心に約3600銘柄を含む。表17.1は、米国と世界の株式市場でよく引用される指標の一部を示す。
Measure of the Stock Market 株式市場の指標 |
Comments 説明 |
|---|---|
Dow Jones Industrial Average (DJIA): https://www.spglobal.com/spdji/en/ ダウ・ジョーンズ工業株平均(DJIA):https://www.spglobal.com/spdji/en/ |
Based on 30 large companies from a diverse set of representative industries, chosen by analysts at Dow Jones and Company. The index was started in 1896. ダウ・ジョーンズ社のアナリストが、代表的な多様な産業から選んだ大企業30社に基づく。1896年に始まった。 |
Standard & Poor’s 500: http://www.standardandpoors.com スタンダード&プアーズ500:http://www.standardandpoors.com |
Based on 500 large U.S. firms, chosen by analysts at Standard & Poor’s to represent the economy as a whole. スタンダード&プアーズのアナリストが、経済全体を代表するよう選んだ米国の大企業500社に基づく。 |
Wilshire 5000: http://www.wilshire.com ウィルシャー5000:http://www.wilshire.com |
Includes essentially all U.S. companies with stock ownership. Despite the name, this index includes about 7,000 firms. 株式所有のある米国のほぼ全企業を含む。名称とは異なり、約7000社を含む指数である。 |
New York Stock Exchange: http://www.nyse.com ニューヨーク証券取引所:http://www.nyse.com |
The oldest and largest U.S. stock market, dating back to 1792. It trades stocks for 2,800 companies of all sizes. It is located at 18 Broad St. in New York City. 1792年にさかのぼる、米国最古かつ最大の株式市場。あらゆる規模の2800社の株式を売買する。所在地はニューヨーク市ブロード通り18番地。 |
NASDAQ: http://www.nasdaq.com ナスダック:http://www.nasdaq.com |
Founded in 1971 as an electronic stock market, allowing people to buy or sell from many physical locations. It has about 3,600 companies. 1971年、さまざまな場所から売買できる電子株式市場として設立された。約3600社を扱う。 |
FTSE: http://www.ftse.com FTSE:http://www.ftse.com |
Includes the 100 largest companies on the London Stock Exchange. Pronounced “footsie.” Originally stood for Financial Times Stock Exchange. ロンドン証券取引所の最大級の100社を含む。「フッツィー」と発音する。もとはFinancial Times Stock Exchangeの略だった。 |
Nikkei: http://www.nikkei.co.jp/nikkeiinfo/en/ 日経:http://www.nikkei.co.jp/nikkeiinfo/en/ |
Nikkei stands for Nihon Keizai Shimbun, which translates as the Japan Economic Journal, a major business newspaper in Japan. Index includes the 225 largest and most actively traded stocks on the Tokyo Stock Exchange. Nikkeiは日本経済新聞の略で、英訳するとJapan Economic Journalとなり、日本の主要な経済紙である。指数には東京証券取引所の規模が大きく、最も活発に売買される225銘柄が含まれる。 |
DAX: http://www.exchange.de DAX:http://www.exchange.de |
Tracks 30 of the largest companies on the Frankfurt, Germany, stock exchange. DAX is an abbreviation for Deutscher Aktien Index (German Stock Index). ドイツのフランクフルト証券取引所で最大級の30社を追う。DAXはDeutscher Aktien Index(ドイツ株価指数)の略である。 |
The trend in the stock market is generally up over time, but with some large dips along the way. Figure 17.6 shows the path of the Standard & Poor’s 500 index (which is measured on the left-hand vertical axis) and the Dow Jones Index (which is measured on the right-hand vertical axis). Broad stock market measures, like the ones we list here, tend to move together. The S&P 500 Index is the weighted average market capitalization of the firms selected to be in the index. The Dow Jones Industrial Average is the price weighted average of 30 industrial stocks tracked on the New York Stock Exchange.
英語のヒント
株式市場は、途中に大きな下落を挟みながらも、一般に長期的には上昇する。図17.6は、左の縦軸で測るS&P 500と、右の縦軸で測るダウ・ジョーンズ指数の推移を示す。ここに挙げたような広範な株価指標は一緒に動く傾向がある。S&P 500は採用企業の時価総額の加重平均である。ダウ・ジョーンズ工業株平均は、ニューヨーク証券取引所で追跡する工業株30銘柄の株価加重平均である。
When the Dow Jones average rises from 5,000 to 10,000, you know that the average price of the stocks in that index has roughly doubled. Figure 17.6 shows that stock prices did not rise much in the 1970s, but then started a steady climb in the 1980s. From 2000 to 2013, stock prices bounced up and down, but ended up at about the same level.
英語のヒント
ダウ平均が5000から1万へ上がれば、採用銘柄の平均価格がおおよそ2倍になったとわかる。図17.6は、1970年代には株価があまり上がらず、1980年代に着実な上昇を始めたことを示す。2000年から2013年までは上下したが、結局ほぼ同じ水準になった。
The Dow Jones Industrial Index and the Standard & Poor’s 500, 1965–2021ダウ・ジョーンズ工業株指数とS&P 500、1965〜2021年
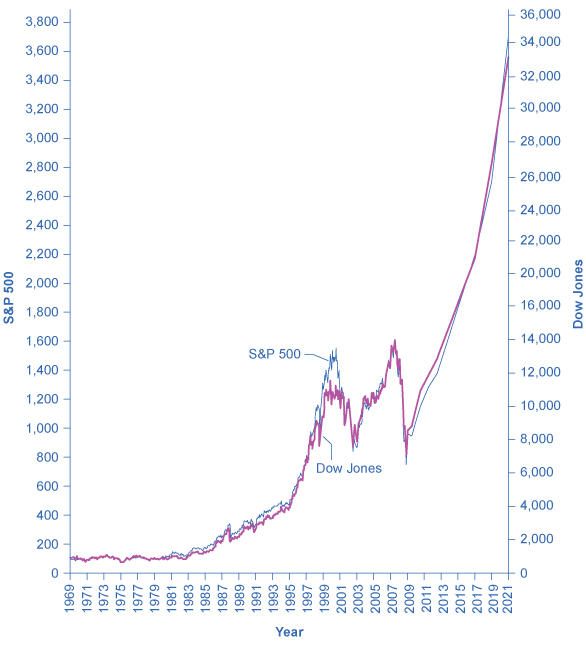

Figure 17.6図 17.6
Stock prices rose dramatically from the 1980s up to about 2000. From 2000 to 2013, stock prices bounced up and down, but ended up at about the same level. Since 2009, both indexes have for the most part increased.
英語のヒント
株価は1980年代から2000年ごろまで劇的に上昇した。2000年から2013年は上下したが、結局ほぼ同じ水準になった。2009年以降、両指数はおおむね上昇している。
Table 17.2 shows the total annual rate of return an investor would have received from buying the stocks in the S&P 500 index over recent decades. The total return here includes both dividends paid by these companies and also capital gains arising from increases in the stock value. (For technical reasons related to how we calculate the numbers, the dividends and capital gains do not add exactly to the total return.) From the 1950s to the 1980s, the average firm paid annual dividends equal to about 4% of its stock value. Since the 1990s, dividends have dropped and now often provide a return closer to 1% to 2%. In the 1960s and 1970s, the gap between percent earned on capital gains and dividends was much closer than it has been since the 1980s. In the 1980s and 1990s, capital gains were far higher than dividends. In the 2000s, dividends remained low and, while stock prices fluctuated, they ended the decade roughly where they had started. In the 2010s, dividends remained low and stock prices increased, and this continued at the beginning of the 2020s.
英語のヒント
表17.2は、ここ数十年にS&P 500採用銘柄を買った投資家が得たはずの年間総収益率を示す。総収益には企業の配当と株価上昇によるキャピタルゲインの両方が含まれる。(計算方法に関する技術的な理由で、配当とキャピタルゲインの合計は総収益と厳密には一致しない。)1950年代から1980年代には、平均的な企業は株価の約4%に当たる年間配当を払っていた。1990年代以降、配当は低下し、今では1〜2%に近い収益を与える場合が多い。1960年代と1970年代には、キャピタルゲインと配当の収益率の差は、1980年代以降よりはるかに小さかった。1980年代と1990年代にはキャピタルゲインが配当を大きく上回った。2000年代は配当が低いままで、株価は変動したものの、10年の終わりには始めとほぼ同水準だった。2010年代も配当は低く、株価は上昇し、2020年代初めにもこの状態が続いた。
Period 期間 |
Total Annual Return 年間総収益率 |
Capital Gains キャピタルゲイン |
Dividends 配当 |
|---|---|---|---|
1950–1959 |
19.25% |
13.58% |
4.99% |
1960–1969 |
7.78% |
4.39% |
3.25% |
1970–1979 |
5.88% |
1.60% |
4.20% |
1980–1989 |
17.55% |
12.59% |
4.40% |
1990–1999 |
18.21% |
15.31% |
2.51% |
2000–2009 |
−1.00% |
−2.70% |
1.70% |
2010–2019 |
12.65% |
10.35% |
2.30% |
2020 |
18.40% |
16.26% |
2.14% |
2021 |
28.71% |
26.89% |
1.82% |
The overall pattern is that stocks as a group have provided a high rate of return over extended periods of time, but this return comes with risks. The market value of individual companies can rise and fall substantially, both over short time periods and over the long run. During extended periods of time like the 1970s or the first decade of the 2000s, the overall stock market return can be quite modest. The stock market can sometimes fall sharply, as it did in 2008.
英語のヒント
全体として、株式はまとまった集団として見れば長期間に高い収益率をもたらしてきたが、この収益にはリスクが伴う。個別企業の市場価値は短期間にも長期間にも大きく上下しうる。1970年代や2000年代最初の10年のような長い期間、市場全体の収益がかなり控えめなこともある。2008年のように株式市場が急落する場合もある。
The bottom line on investing in stocks is that the rate of return over time will be high, but the risks are also high, especially in the short run. Liquidity is also high since one can sell stock in publicly held companies readily for spendable money.
英語のヒント
株式投資をまとめると、長期の収益率は高いが、特に短期のリスクも高い。公開会社の株式は容易に売って使えるお金にできるため、流動性も高い。