第24章総需要・総供給モデル
24.5 How the AD/AS Model Incorporates Growth, Unemployment, and Inflation24.5 AD/ASモデルは成長・失業・インフレをどう組み込むか
Learning Objectives学習目標
Learning Objectives学習目標
By the end of this section, you will be able to:
英語のヒント
この節を学ぶと、次のことができるようになる。
- Use the aggregate demand/aggregate supply model to show periods of economic growth and recession
英語のヒント
総需要・総供給モデルを使い、経済成長期と景気後退期を示す - Explain how unemployment and inflation impact the aggregate demand/aggregate supply model
英語のヒント
失業とインフレが総需要・総供給モデルにどう影響するか説明する - Evaluate the importance of the aggregate demand/aggregate supply model
英語のヒント
総需要・総供給モデルの重要性を評価する
The AD/AS model can convey a number of interlocking relationships between the three macroeconomic goals of growth, unemployment, and low inflation. Moreover, the AD/AS framework is flexible enough to accommodate both the Keynes’ law approach that focuses on aggregate demand and the short run, while also including the Say’s law approach that focuses on aggregate supply and the long run. These advantages are considerable. Every model is a simplified version of the deeper reality and, in the context of the AD/AS model, the three macroeconomic goals arise in ways that are sometimes indirect or incomplete. In this module, we consider how the AD/AS model illustrates the three macroeconomic goals of economic growth, low unemployment, and low inflation.
英語のヒント
AD/ASモデルは、成長、失業、低インフレというマクロ経済の三つの目標の間にある、多くの連動する関係を伝えられる。さらにAD/ASの枠組みは、総需要と短期に焦点を当てるケインズの法則のアプローチと、総供給と長期に焦点を当てるセイの法則のアプローチの両方を取り入れられるほど柔軟である。これらは大きな利点である。あらゆるモデルは、より奥深い現実を単純化したものであり、AD/ASモデルでは、三つのマクロ経済目標の現れ方が間接的または不完全になる場合がある。本節では、AD/ASモデルが、経済成長、低失業、低インフレの三つのマクロ経済目標をどう示すかを考える。
Growth and Recession in the AD/AS DiagramAD/AS図における成長と景気後退
In the AD/AS diagram, long-run economic growth due to productivity increases over time will be represented by a gradual shift to the right of aggregate supply. The vertical line representing potential GDP (or the “full employment level of GDP”) will gradually shift to the right over time as well. Earlier Figure 24.7 (a) showed a pattern of economic growth over three years, with the AS curve shifting slightly out to the right each year. However, the factors that determine the speed of this long-term economic growth rate—like investment in physical and human capital, technology, and whether an economy can take advantage of catch-up growth—do not appear directly in the AD/AS diagram.
英語のヒント
AD/AS図では、時間とともに生産性が高まることによる長期的な経済成長は、総供給の緩やかな右方シフトで表される。潜在GDP(または「完全雇用GDP水準」)を表す垂直線も、時間とともに徐々に右へシフトする。先の図24.7(a)は3年間の経済成長のパターンを示し、AS曲線は毎年わずかに右へ外側にシフトしていた。しかし、この長期的な経済成長率の速さを決める要因、例えば物的資本と人的資本への投資、技術、そして経済がキャッチアップ成長を活用できるかどうかは、AD/AS図に直接は現れない。
In the short run, GDP falls and rises in every economy, as the economy dips into recession or expands out of recession. The AD/AS diagram illustrates recessions when the equilibrium level of real GDP is substantially below potential GDP, as we see at the equilibrium point E0 in Figure 24.9. From another standpoint, in years of resurgent economic growth the equilibrium will typically be close to potential GDP, as equilibrium point E1 in that earlier figure shows.
英語のヒント
短期には、どの経済でも、景気後退に陥ったり、そこから拡大して脱したりするにつれ、GDPは減ったり増えたりする。AD/AS図は、図24.9の均衡点E0のように、実質GDPの均衡水準が潜在GDPを大幅に下回るとき、景気後退を示す。別の観点からは、経済成長が盛り返す年には、先の図の均衡点E1が示すように、均衡は通常、潜在GDPに近くなる。
Unemployment in the AD/AS DiagramAD/AS図における失業
We described two types of unemployment in the Unemployment chapter. Short run variations in unemployment (cyclical unemployment) are caused by the business cycle as the economy expands and contracts. Over the long run, in the United States, the unemployment rate typically hovers around 5% (give or take one percentage point or so), when the economy is healthy. In many of the national economies across Europe, the unemployment rate in recent decades has only dropped to about 10% or a bit lower, even in good economic years. We call this baseline level of unemployment that occurs year-in and year-out the natural rate of unemployment and we determine it by how well the structures of market and government institutions in the economy lead to a matching of workers and employers in the labor market. Potential GDP can imply different unemployment rates in different economies, depending on the natural rate of unemployment for that economy.
英語のヒント
「失業」の章で、二種類の失業を説明した。失業の短期的な変動(循環的失業)は、経済が拡大・縮小する景気循環によって生じる。長期にわたり、米国では経済が健全なとき、失業率は通常5%前後(およそ1パーセントポイントの上下を含む)で推移する。ヨーロッパの多くの国では、近年の数十年間、経済がよい年でも失業率は約10%かそれを少し下回る程度までしか下がっていない。毎年生じるこの基礎的な失業水準を自然失業率と呼ぶ。それは、経済の市場制度と政府制度の構造が、労働市場で労働者と雇用主をどれほどよく結びつけるかによって決まる。潜在GDPに対応する失業率は、各経済の自然失業率によって、経済ごとに異なりうる。
The AD/AS diagram shows cyclical unemployment by how close the economy is to the potential or full GDP employment level. Returning to Figure 24.9, relatively low cyclical unemployment for an economy occurs when the level of output is close to potential GDP, as in the equilibrium point E1. Conversely, high cyclical unemployment arises when the output is substantially to the left of potential GDP on the AD/AS diagram, as at the equilibrium point E0. Although we do not show the factors that determine the natural rate of unemployment separately in the AD/AS model, they are implicitly part of what determines potential GDP or full employment GDP in a given economy.
英語のヒント
AD/AS図は、経済が潜在GDP、すなわち完全雇用GDP水準にどれほど近いかによって、循環的失業を示す。図24.9に戻ると、均衡点E1のように生産水準が潜在GDPに近いとき、循環的失業は比較的少ない。反対に、均衡点E0のように、AD/AS図で生産が潜在GDPから大きく左にあるとき、循環的失業は多い。自然失業率を決める要因はAD/ASモデルに別個には示していないが、それらは暗黙に、その経済の潜在GDPや完全雇用GDPを決めるものの一部になっている。
Inflationary Pressures in the AD/AS DiagramAD/AS図におけるインフレ圧力
Inflation fluctuates in the short run. Higher inflation rates have typically occurred either during or just after economic booms: for example, the biggest spurts of inflation in the U.S. economy during the twentieth century followed the wartime booms of World War I and World War II. Conversely, rates of inflation generally decline during recessions. As an extreme example, inflation actually became negative—a situation called “deflation”—during the Great Depression. Even during the relatively short 1991-1992 recession, the inflation rate declined from 5.4% in 1990 to 3.0% in 1992. During the relatively short 2001 recession, the rate of inflation declined from 3.4% in 2000 to 1.6% in 2002. During the deep recession of 2007–2009, the inflation rate declined from 3.8% in 2008 to –0.4% in 2009. Some countries have experienced bouts of high inflation that lasted for years. In the U.S. economy since the mid–1980s, inflation does not seem to have had any long-term trend to be substantially higher. Instead, it has stayed in the 1–5% range annually.
英語のヒント
インフレは短期的に変動する。インフレ率が高くなるのは通常、好況中かその直後である。例えば20世紀の米国経済で最も大きなインフレの急上昇は、第一次世界大戦と第二次世界大戦の戦時好況に続いて起きた。反対に、景気後退中にはインフレ率は通常低下する。極端な例では、大恐慌中にインフレは実際に負となり、「デフレ」と呼ばれる状況になった。比較的短い1991~1992年の景気後退でさえ、インフレ率は1990年の5.4%から1992年の3.0%へ下がった。比較的短い2001年の景気後退では、2000年の3.4%から2002年の1.6%へ下がった。2007~2009年の深い景気後退では、2008年の3.8%から2009年の−0.4%へ下がった。何年も高インフレが続いた国もある。1980年代半ば以降の米国経済では、インフレが長期的に大きく高まる傾向は見られない。むしろ年1~5%の範囲にとどまってきた。
The AD/AS framework implies two ways that inflationary pressures may arise. One possible trigger is if aggregate demand continues to shift to the right when the economy is already at or near potential GDP and full employment, thus pushing the macroeconomic equilibrium into the AS curve's steep portion. In Figure 24.10 (a), there is a shift of aggregate demand to the right. The new equilibrium E1 is clearly at a higher price level than the original equilibrium E0. In this situation, the aggregate demand in the economy has soared so high that firms in the economy are not capable of producing additional goods, because labor and physical capital are fully employed, and so additional increases in aggregate demand can only result in a rise in the price level.
英語のヒント
AD/ASの枠組みは、インフレ圧力が生じうる二つの経路を示す。一つの引き金は、経済がすでに潜在GDPと完全雇用、またはその近くにあるのに、総需要が右へシフトし続け、マクロ経済の均衡をAS曲線の急な部分へ押し込むことである。図24.10(a)では総需要が右へシフトしている。新しい均衡E1は、元の均衡E0より明らかに高い物価水準にある。この状況では、経済の総需要が非常に高まっているが、労働と物的資本が完全に用いられているため、企業は追加の財を生産できない。そのため、総需要をさらに増やしても物価水準が上がるだけである。
Sources of Inflationary Pressure in the AD/AS ModelAD/ASモデルにおけるインフレ圧力の源
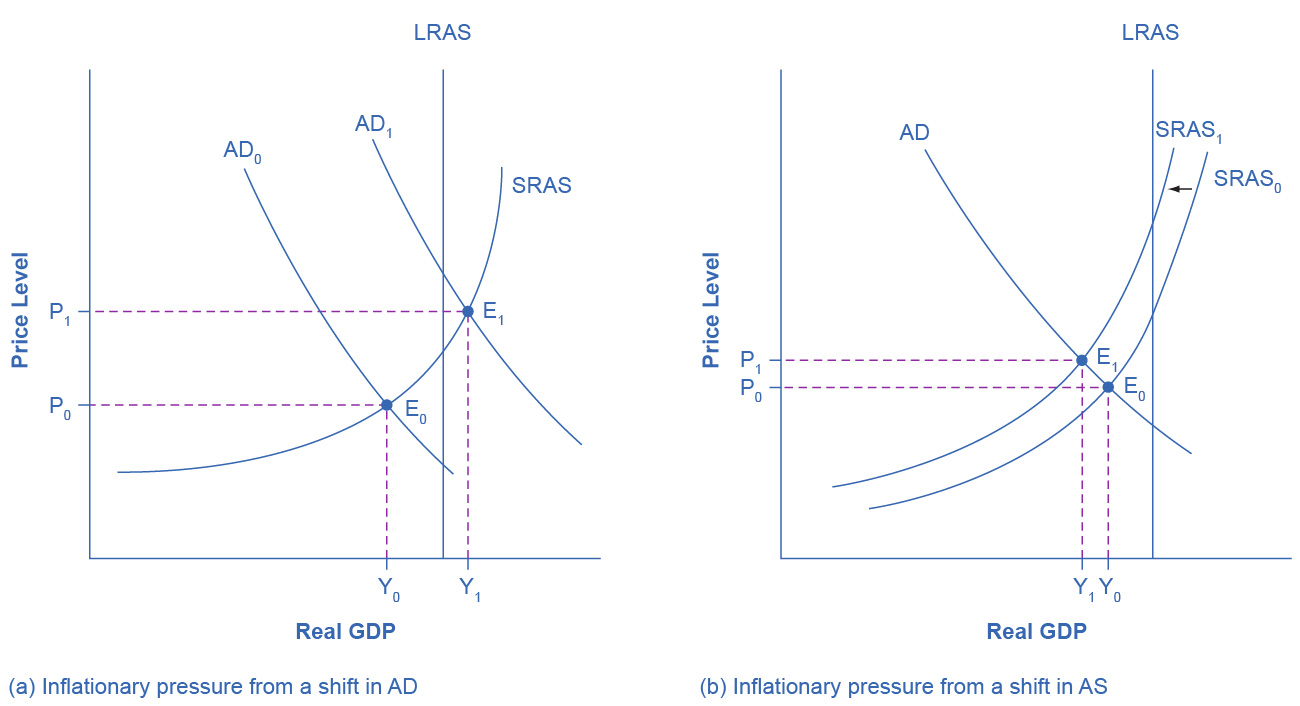

Figure 24.10図 24.10
(a) A shift in aggregate demand, from AD0 to AD1, when it happens in the area of the SRAS curve that is near potential GDP, will lead to a higher price level and to pressure for a higher price level and inflation. The new equilibrium (E1) is at a higher price level (P1) than the original equilibrium. (b) A shift in aggregate supply, from SRAS0 to SRAS1, will lead to a lower real GDP and to pressure for a higher price level and inflation. The new equilibrium (E1) is at a higher price level (P1), while the original equilibrium (E0) is at the lower price level (P0).
英語のヒント
(a)総需要のAD0からAD1へのシフトが、潜在GDPに近いSRAS曲線の部分で起こると、物価水準が上がり、さらなる物価上昇とインフレへの圧力が生じる。新しい均衡(E1)は、元の均衡より高い物価水準(P1)にある。(b)総供給のSRAS0からSRAS1へのシフトは、実質GDPを減らし、物価上昇とインフレへの圧力を生む。新しい均衡E1は高い物価水準P1にあり、元の均衡E0は低い物価水準P0にある。
An alternative source of inflationary pressures can occur due to a rise in input prices that affects many or most firms across the economy—perhaps an important input to production like oil or labor—and causes the aggregate supply curve to shift back to the left. In Figure 24.10 (b), the SRAS curve's shift to the left also increases the price level from P0 at the original equilibrium (E0) to a higher price level of P1 at the new equilibrium (E1). In effect, the rise in input prices ends up, after the final output is produced and sold, passing along in the form of a higher price level for outputs.
英語のヒント
インフレ圧力の別の源は、経済全体の多数または大半の企業に影響する投入価格の上昇である。石油や労働のような重要な投入物かもしれない。それによって総供給曲線は左へ戻る。図24.10(b)でも、SRAS曲線の左方シフトによって、物価水準は元の均衡E0のP0から、新しい均衡E1のより高いP1へ上がる。実質的には、投入価格の上昇は、最終生産物が生産・販売された後、生産物の高い物価水準という形で転嫁される。
The AD/AS diagram shows only a one-time shift in the price level. It does not address the question of what would cause inflation either to vanish after a year, or to sustain itself for several years. There are two explanations for why inflation may persist over time. One way that continual inflationary price increases can occur is if the government continually attempts to stimulate aggregate demand in a way that keeps pushing the AD curve when it is already in the SRAS curve's steep portion. A second possibility is that, if inflation has been occurring for several years, people might begin to expect a certain level of inflation. If they do, then these expectations will cause prices, wages and interest rates to increase annually by the amount of the inflation expected. These two reasons are interrelated, because if a government fosters a macroeconomic environment with inflationary pressures, then people will grow to expect inflation. However, the AD/AS diagram does not show these patterns of ongoing or expected inflation in a direct way.
英語のヒント
AD/AS図は、物価水準の一度のシフトしか示さない。インフレが1年で消えるか、数年間続くかを何が決めるかという問いには答えない。インフレが長く続きうる理由には二つの説明がある。持続的なインフレ的価格上昇が起きる一つの経路は、AD曲線がすでにSRAS曲線の急な部分にあるのに、政府がAD曲線を押し続ける形で、総需要を継続的に刺激しようとすることである。もう一つの可能性は、インフレが数年続くと、人々が一定水準のインフレを予想し始めることである。そうなれば、その予想によって物価、賃金、利子率が、毎年予想インフレ分だけ上がる。この二つの理由は相互に関係する。政府がインフレ圧力のあるマクロ経済環境を作れば、人々はインフレを予想するようになるからである。しかしAD/AS図は、こうした継続的・予想されるインフレのパターンを直接には示さない。