第24章総需要・総供給モデル
24.2 Building a Model of Aggregate Demand and Aggregate Supply24.2 総需要・総供給モデルを組み立てる
Learning Objectives学習目標
Learning Objectives学習目標
By the end of this section, you will be able to:
英語のヒント
この節を学ぶと、次のことができるようになる。
- Explain the aggregate supply curve and how it relates to real GDP and potential GDP
英語のヒント
総供給曲線と、それが実質GDPおよび潜在GDPとどう関係するかを説明する - Explain the aggregate demand curve and how it is influenced by price levels
英語のヒント
総需要曲線と、それが物価水準にどう影響されるかを説明する - Interpret the aggregate demand/aggregate supply model
英語のヒント
総需要・総供給モデルを読み取る - Identify the point of equilibrium in the aggregate demand/aggregate supply model
英語のヒント
総需要・総供給モデルの均衡点を特定する - Define short run aggregate supply and long run aggregate supply
英語のヒント
短期総供給と長期総供給を定義する
To build a useful macroeconomic model, we need a model that shows what determines total supply or total demand for the economy, and how total demand and total supply interact at the macroeconomic level. We call this the aggregate demand/aggregate supply model. This module will explain aggregate supply, aggregate demand, and the equilibrium between them. The following modules will discuss the causes of shifts in aggregate supply and aggregate demand.
英語のヒント
役に立つマクロ経済モデルを組み立てるには、経済の総供給や総需要を何が決め、マクロ経済の水準で総需要と総供給がどう相互作用するかを示すモデルが必要である。これを総需要・総供給モデルと呼ぶ。本節では、総供給、総需要、両者の間の均衡を説明する。続く節では、総供給と総需要がシフトする原因を論じる。
The Aggregate Supply Curve and Potential GDP総供給曲線と潜在GDP
Firms make decisions about what quantity to supply based on the profits they expect to earn. They determine profits, in turn, by the price of the outputs they sell and by the prices of the inputs, like labor or raw materials, that they need to buy. Aggregate supply (AS) refers to the total quantity of output (i.e. real GDP) firms will produce and sell. The aggregate supply (AS) curve shows the total quantity of output (i.e. real GDP) that firms will produce and sell at each price level.
英語のヒント
企業は、得られると期待する利益に基づいて、どれだけ供給するかを決める。一方、その利益は、売る生産物の価格と、買う必要がある労働や原材料などの投入物の価格によって決める。総供給(AS)とは、企業が生産して販売する生産物の総量(すなわち実質GDP)を指す。総供給(AS)曲線は、各物価水準で企業が生産・販売する生産物の総量(すなわち実質GDP)を示す。
Figure 24.3 shows an aggregate supply curve. In the following paragraphs, we will walk through the elements of the diagram one at a time: the horizontal and vertical axes, the aggregate supply curve itself, and the meaning of the potential GDP vertical line.
英語のヒント
図24.3は総供給曲線を示す。以下の段落では、横軸と縦軸、総供給曲線そのもの、潜在GDPを表す垂直線の意味という、図の各要素を一つずつ見ていく。
The Aggregate Supply Curve総供給曲線
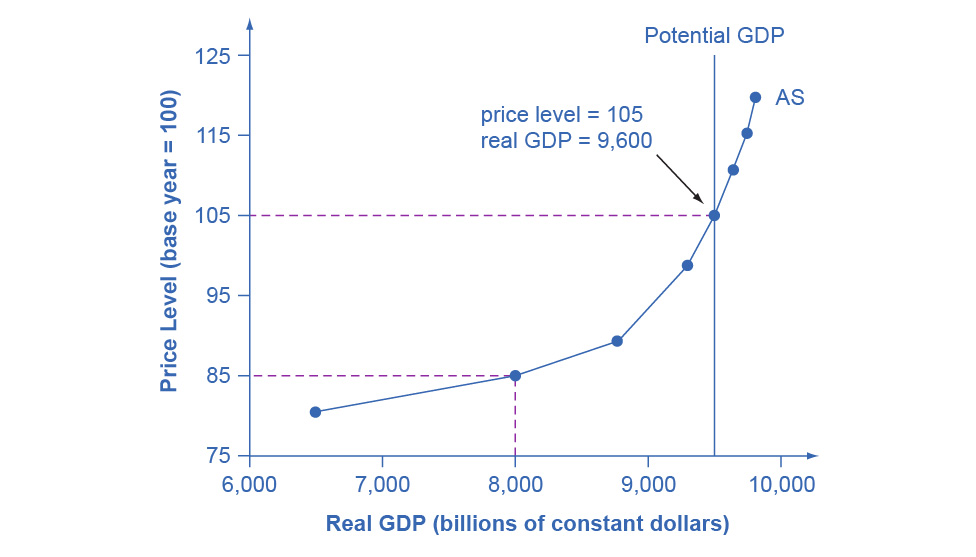

Figure 24.3図 24.3
Aggregate supply (AS) slopes up, because as the price level for outputs rises, with the price of inputs remaining fixed, firms have an incentive to produce more to earn higher profits. The potential GDP line shows the maximum that the economy can produce with full employment of workers and physical capital.
英語のヒント
総供給(AS)は右上がりである。投入物の価格を一定とすると、生産物の物価水準が上がるにつれて、企業にはより高い利益を得るために生産を増やす誘因があるからである。潜在GDP線は、労働者と物的資本を完全雇用した場合に経済が生産できる最大量を示す。
The diagram's horizontal axis shows real GDP—that is, the level of GDP adjusted for inflation. The vertical axis shows the price level, which measures the average price of all goods and services produced in the economy. In other words, the price level in the AD-AS model is what we called the GDP Deflator in The Macroeconomic Perspective. Remember that the price level is different from the inflation rate. Visualize the price level as an index number, like the Consumer Price Index, while the inflation rate is the percentage change in the price level over time.
英語のヒント
図の横軸は実質GDP、つまりインフレ調整後のGDP水準を示す。縦軸は物価水準で、経済で生産されるすべての財とサービスの平均価格を測る。言い換えると、AD–ASモデルの物価水準は、「マクロ経済的な見方」でGDPデフレーターと呼んだものである。物価水準とインフレ率は異なることを思い出そう。物価水準は消費者物価指数のような指数として捉え、インフレ率は時間の経過に伴う物価水準の変化率であると考えよう。
As the price level rises, real GDP rises as well. Why? The price level on the vertical axis represents prices for final goods or outputs bought in the economy—i.e. the GDP deflator—not the price level for intermediate goods and services that are inputs to production. Thus, the AS curve describes how suppliers will react to a higher price level for final outputs of goods and services, while holding the prices of inputs like labor and energy constant. If firms across the economy face a situation where the price level of what they produce and sell is rising, but their costs of production are not rising, then the lure of higher profits will induce them to expand production. In other words, an aggregate supply curve shows how producers as a group will respond to an increase in aggregate demand.
英語のヒント
物価水準が上がると、実質GDPも増える。なぜだろうか。縦軸の物価水準は、経済で購入される最終財、すなわち生産物の価格、つまりGDPデフレーターを表し、生産への投入物である中間財・サービスの物価水準ではない。したがってAS曲線は、労働やエネルギーなどの投入物価格を一定に保ったとき、財・サービスの最終生産物の物価水準の上昇に供給者がどう反応するかを描く。経済全体の企業が、自ら生産・販売するものの物価水準は上がるが、生産費用は上がらない状況に直面すれば、高い利益の魅力が企業に生産拡大を促す。言い換えると、総供給曲線は、生産者が全体として総需要の増加にどう反応するかを示す。
An AS curve's slope changes from nearly flat at its far left to nearly vertical at its far right. At the far left of the aggregate supply curve, the level of output in the economy is far below potential GDP, which we define as the amount of real GDP an economy can produce by fully employing its existing levels of labor, physical capital, and technology, in the context of its existing market and legal institutions. At these relatively low levels of output, levels of unemployment are high, and many factories are running only part-time, or have closed their doors. In this situation, a relatively small increase in the prices of the outputs that businesses sell—while assuming no rise in input prices—can encourage a considerable surge in the quantity of aggregate supply because so many workers and factories are ready to swing into production.
英語のヒント
AS曲線の傾きは、左端のほぼ水平から、右端のほぼ垂直へ変化する。総供給曲線の左端では、経済の生産水準は潜在GDPを大きく下回る。潜在GDPとは、既存の市場制度・法制度のもとで、現在ある労働、物的資本、技術を完全に用いて経済が生産できる実質GDPの量である。この比較的低い生産水準では失業率が高く、多くの工場は部分的にしか稼働していないか、閉鎖されている。この状況では、投入物価格が上がらないと仮定すると、企業が売る生産物の価格が比較的わずかに上がるだけで、総供給量がかなり急増しうる。非常に多くの労働者と工場が生産に移る準備を整えているからである。
As the GDP increases, however, some firms and industries will start running into limits: perhaps nearly all of the expert workers in a certain industry will have jobs or factories in certain geographic areas or industries will be running at full speed. In the AS curve's intermediate area, a higher price level for outputs continues to encourage a greater quantity of output—but as the increasingly steep upward slope of the aggregate supply curve shows, the increase in real GDP in response to a given rise in the price level will not be as large. (Read the following Clear It Up feature to learn why the AS curve crosses potential GDP.)
英語のヒント
しかしGDPが増えるにつれ、一部の企業や産業は限界に突き当たり始める。特定の産業の熟練労働者のほぼ全員が職に就くか、特定の地域や産業の工場が全速力で稼働するようになるかもしれない。AS曲線の中間領域では、生産物の物価水準が上がると引き続き生産量が増える。しかし、総供給曲線の右上がりの傾きが次第に急になることが示すように、一定の物価上昇に対する実質GDPの増加は、それほど大きくなくなる。(AS曲線が潜在GDPと交わる理由は、次の「疑問を解こう」を読もう。)
At the far right, the aggregate supply curve becomes nearly vertical. At this quantity, higher prices for outputs cannot encourage additional output, because even if firms want to expand output, the inputs of labor and machinery in the economy are fully employed. In this example, the vertical line in the exhibit shows that potential GDP occurs at a total output of 9,500. When an economy is operating at its potential GDP, machines and factories are running at capacity, and the unemployment rate is relatively low—at the natural rate of unemployment. For this reason, potential GDP is sometimes also called full-employment GDP.
英語のヒント
右端では総供給曲線がほぼ垂直になる。この数量では、企業が生産を拡大したくても、経済の労働や機械という投入物が完全に用いられているため、生産物の価格が上がっても追加生産を促せない。この例では、図の垂直線は、総生産9500で潜在GDPとなることを示す。経済が潜在GDPで動いているとき、機械や工場は能力いっぱいに稼働し、失業率は比較的低い自然失業率にある。そのため、潜在GDPは完全雇用GDPとも呼ばれる。