第24章総需要・総供給モデル
How Government Macroeconomic Policy Choices Can Shift AD政府のマクロ経済政策の選択はADをどうシフトさせるか
Government spending is one component of AD. Thus, higher government spending will cause AD to shift to the right, as in Figure 24.8 (a), while lower government spending will cause AD to shift to the left, as in Figure 24.8 (b). For example, in the United States, government spending declined by 3.2% of GDP during the 1990s, from 21% of GDP in 1991, and to 17.8% of GDP in 1998. However, from 2005 to 2009, the peak of the Great Recession, government spending increased from 19% of GDP to 21.4% of GDP. If changes of a few percentage points of GDP seem small to you, remember that since GDP was about $14.4 trillion in 2009, a seemingly small change of 2% of GDP is equal to close to $300 billion. Since 2009, government expenditures have gone back down to around 17–18% of GDP, although in 2020 they rose to 18.5%.
英語のヒント
政府支出はADの構成要素の一つである。したがって、政府支出の増加は図24.8(a)のようにADを右へ、政府支出の減少は図24.8(b)のようにADを左へシフトさせる。例えば米国では、1990年代に政府支出がGDPの3.2%分減り、1991年のGDP比21%から1998年の17.8%へ低下した。しかし2005年から大不況の最盛期の2009年には、政府支出はGDP比19%から21.4%へ増えた。GDPの数パーセントポイントの変化が小さく見えるなら、2009年のGDPは約14兆4000億ドルだったため、一見小さなGDPの2%の変化でも3000億ドル近くに相当することを思い出そう。2009年以降、政府支出はGDP比約17~18%へ下がったが、2020年には18.5%へ上がった。
Tax policy can affect consumption and investment spending, too. Tax cuts for individuals will tend to increase consumption demand, while tax increases will tend to diminish it. Tax policy can also pump up investment demand by offering lower tax rates for corporations or tax reductions that benefit specific kinds of investment. Shifting C or I will shift the AD curve as a whole.
英語のヒント
税制も消費支出と投資支出に影響しうる。個人への減税は消費需要を増やす傾向があり、増税は減らす傾向がある。税制は、法人税率の引き下げや、特定の投資に有利な税軽減によって、投資需要を押し上げることもできる。CまたはIが動くと、AD曲線全体がシフトする。
During a recession, when unemployment is high and many businesses are suffering low profits or even losses, the U.S. Congress often passes tax cuts. During the 2001 recession, for example, the U.S. Congress enacted a tax cut into law. At such times, the political rhetoric often focuses on how people experiencing hard times need relief from taxes. The aggregate supply and aggregate demand framework, however, offers a complementary rationale, as Figure 24.9 illustrates. The original equilibrium during a recession is at point E0, relatively far from the full employment level of output. The tax cut, by increasing consumption, shifts the AD curve to the right. At the new equilibrium (E1), real GDP rises and unemployment falls and, because in this diagram the economy has not yet reached its potential or full employment level of GDP, any rise in the price level remains muted. Read the following Clear It Up feature to consider the question of whether economists favor tax cuts or oppose them.
英語のヒント
景気後退中、失業が多く、多くの企業が低利益や損失に苦しむとき、米国議会は減税を可決することが多い。例えば2001年の景気後退では、米国議会は減税を法制化した。そのようなとき、政治的な言説は、苦しい時期を過ごす人には税負担の軽減が必要だという点に集中しがちである。しかし総供給・総需要の枠組みは、図24.9のように、それを補完する根拠を提供する。景気後退中の元の均衡は、完全雇用の生産水準から比較的遠い点E0にある。減税は消費を増やすことでAD曲線を右へシフトさせる。新しい均衡E1では、実質GDPが増え、失業が減る。この図では経済がまだ潜在GDP、すなわち完全雇用GDPに達していないため、物価水準の上昇は抑えられたままである。経済学者が減税に賛成するか反対するかを考えるため、次の「疑問を解こう」を読もう。
Recession and Full Employment in the AD/AS ModelAD/ASモデルにおける景気後退と完全雇用
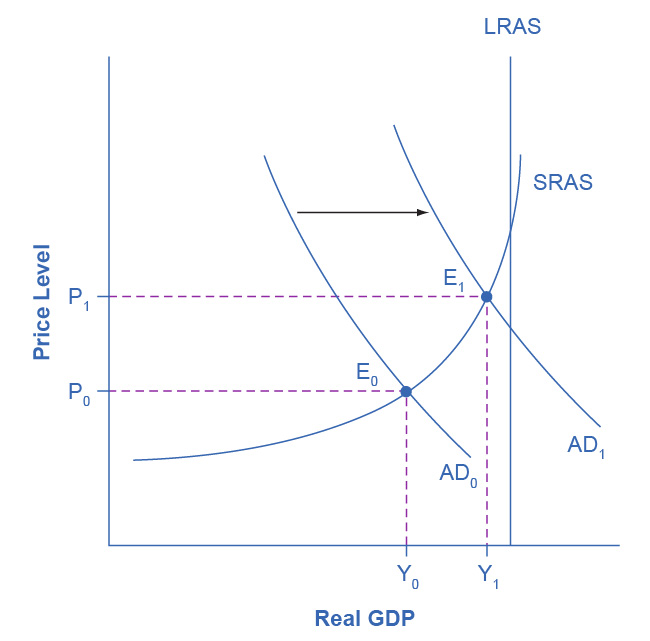

Figure 24.9図 24.9
Whether the economy is in a recession is illustrated in the AD/AS model by how close the equilibrium is to the potential GDP line as indicated by the vertical LRAS line. In this example, the level of output Y0 at the equilibrium E0 is relatively far from the potential GDP line, so it can represent an economy in recession, well below the full employment level of GDP. In contrast, the level of output Y1 at the equilibrium E1 is relatively close to potential GDP, and so it would represent an economy with a lower unemployment rate.
英語のヒント
経済が景気後退にあるかは、AD/ASモデルでは、均衡が垂直なLRAS線で示す潜在GDP線にどれほど近いかによって描かれる。この例では、均衡E0の生産水準Y0は潜在GDP線から比較的遠いため、完全雇用GDPを大幅に下回る景気後退の経済を表しうる。対照的に、均衡E1の生産水準Y1は潜在GDPに比較的近いため、失業率の低い経済を表すだろう。
Government spending and tax rate changes can be useful tools to affect aggregate demand. We will discuss these in greater detail in the Government Budgets and Fiscal Policy chapter and The Impacts of Government Borrowing. Other policy tools can shift the aggregate demand curve as well. For example, as we will discuss in the Monetary Policy and Bank Regulation chapter, the Federal Reserve can affect interest rates and credit availability. Higher interest rates tend to discourage borrowing and thus reduce both household spending on big-ticket items like houses and cars and investment spending by business. Conversely, lower interest rates will stimulate consumption and investment demand. Interest rates can also affect exchange rates, which in turn will have effects on the export and import components of aggregate demand.
英語のヒント
Clarifying the details of these alternative policies and how they affect the components of aggregate demand can wait for The Keynesian Perspective chapter. Here, the key lesson is that a shift of the aggregate demand curve to the right leads to a greater real GDP and to upward pressure on the price level. Conversely, a shift of aggregate demand to the left leads to a lower real GDP and a lower price level. Whether these changes in output and price level are relatively large or relatively small, and how the change in equilibrium relates to potential GDP, depends on whether the shift in the AD curve is happening in the AS curve's relatively flat or relatively steep portion.
英語のヒント
こうした政策の詳細と、それらが総需要の構成要素にどう影響するかは、「ケインズ派の見方」の章で明らかにすることにしよう。ここでの重要な教訓は、総需要曲線の右方シフトが実質GDPを増やし、物価水準に上昇圧力をかけることである。反対に、総需要の左方シフトは実質GDPと物価水準を下げる。生産や物価水準の変化が比較的大きいか小さいか、均衡の変化が潜在GDPとどう関係するかは、AD曲線のシフトがAS曲線の比較的平坦な部分と比較的急な部分のどちらで起きるかによる。