第24章総需要・総供給モデル
24.4 Shifts in Aggregate Demand24.4 総需要のシフト
Learning Objectives学習目標
Learning Objectives学習目標
By the end of this section, you will be able to:
英語のヒント
この節を学ぶと、次のことができるようになる。
- Explain how imports influence aggregate demand
英語のヒント
輸入が総需要にどう影響するか説明する - Identify ways in which business confidence and consumer confidence can affect aggregate demand
英語のヒント
企業景況感と消費者信頼感が総需要に影響する経路を特定する - Explain how government policy can change aggregate demand
英語のヒント
政府の政策が総需要をどう変えるか説明する - Evaluate why economists disagree on the topic of tax cuts
英語のヒント
減税について経済学者の意見が分かれる理由を評価する
As we mentioned previously, the components of aggregate demand are consumption spending (C), investment spending (I), government spending (G), and spending on exports (X) minus imports (M). (Read the following Clear It Up feature for explanation of why imports are subtracted from exports and what this means for aggregate demand.) A shift of the AD curve to the right means that at least one of these components increased so that a greater amount of total spending would occur at every price level. A shift of the AD curve to the left means that at least one of these components decreased so that a lesser amount of total spending would occur at every price level. The Keynesian Perspective will discuss the components of aggregate demand and the factors that affect them. Here, the discussion will sketch two broad categories that could cause AD curves to shift: changes in consumer or firm behavior and changes in government tax or spending policy.
英語のヒント
先に述べたように、総需要の構成要素は、消費支出(C)、投資支出(I)、政府支出(G)、輸出(X)から輸入(M)を引いた支出である。(輸出から輸入を引く理由と、それが総需要について何を意味するかは、次の「疑問を解こう」を読もう。)AD曲線の右方シフトは、これらの少なくとも一つが増え、すべての物価水準で総支出額が増えることを意味する。AD曲線の左方シフトは、少なくとも一つが減り、すべての物価水準で総支出額が減ることを意味する。「ケインズ派の見方」では、総需要の構成要素とそれに影響する要因を論じる。ここでは、AD曲線をシフトさせうる二つの大きな区分、消費者や企業の行動の変化と、政府の税・支出政策の変化を概観する。
How Changes by Consumers and Firms Can Affect AD消費者と企業の変化はADにどう影響するか
When consumers feel more confident about the future of the economy, they tend to consume more. If business confidence is high, then firms tend to spend more on investment, believing that the future payoff from that investment will be substantial. Conversely, if consumer or business confidence drops, then consumption and investment spending decline.
英語のヒント
消費者が経済の先行きに自信を持つと、消費を増やす傾向がある。企業の景況感が高いと、その投資から将来得られる見返りが大きいと信じ、企業は投資支出を増やす傾向がある。反対に、消費者や企業の景況感が低下すると、消費支出と投資支出は減る。
The University of Michigan publishes a survey of consumer confidence and constructs an index of consumer confidence each month. The survey results are then reported at http://www.sca.isr.umich.edu, which break down the change in consumer confidence among different income levels. According to that index, consumer confidence averaged around 90 prior to the Great Recession, and then it fell to below 60 in late 2008, which was the lowest it had been since 1980. During the 2010s, confidence has climbed from a 2011 low of 55.8 back to a level in the upper 90s, before falling to the lower 70s in 2020 due to the COVID-19 pandemic, which economists consider close to a healthy state.
英語のヒント
ミシガン大学は消費者信頼感調査を公表し、毎月、消費者信頼感指数を作成する。調査結果はhttp://www.sca.isr.umich.eduに掲載され、所得階層ごとに消費者信頼感の変化を分類している。同指数によると、消費者信頼感は大不況前には平均約90だったが、2008年末には60未満へ低下し、1980年以来の最低となった。2010年代には、2011年の最低55.8から90台後半へ回復し、その後2020年には新型コロナウイルスのパンデミックで70台前半へ下がった。経済学者はこれを健全な状態に近いとみなしている。
The Organization for Economic Cooperation and Development (OECD) publishes one measure of business confidence: the "business tendency surveys". The OECD collects business opinion survey data for 21 countries on future selling prices and employment, among other business climate elements. After sharply declining during the Great Recession, the measure has risen above zero again and is back to long-term averages (the indicator dips below zero when business outlook is weaker than usual). Of course, either of these survey measures is not very precise. They can however, suggest when confidence is rising or falling, as well as when it is relatively high or low compared to the past.
英語のヒント
経済協力開発機構(OECD)は企業の景況感の尺度の一つとして「企業動向調査」を公表する。OECDは21か国について、将来の販売価格や雇用など、事業環境のさまざまな要素に関する企業の意見調査データを集める。この指標は大不況中に急落した後、再びゼロを上回り、長期平均に戻っている(企業の見通しが通常より弱いと、指標はゼロを下回る)。もちろん、どちらの調査尺度も非常に正確というわけではない。それでも、信頼感がいつ上昇・低下しているか、また過去に比べていつ比較的高い・低いかを示唆できる。
Because economists associate a rise in confidence with higher consumption and investment demand, it will lead to an outward shift in the AD curve, and a move of the equilibrium, from E0 to E1, to a higher quantity of output and a higher price level, as Figure 24.8 (a) shows.
英語のヒント
経済学者は信頼感の上昇を消費需要と投資需要の増加と結びつけるため、図24.8(a)のように、AD曲線は外へシフトし、均衡はE0からE1へ、生産量も物価水準も高い位置へ移る。
Consumer and business confidence often reflect macroeconomic realities; for example, confidence is usually high when the economy is growing briskly and low during a recession. However, economic confidence can sometimes rise or fall for reasons that do not have a close connection to the immediate economy, like a risk of war, election results, foreign policy events, or a pessimistic prediction about the future by a prominent public figure. U.S. presidents, for example, must be careful in their public pronouncements about the economy. If they offer economic pessimism, they risk provoking a decline in confidence that reduces consumption and investment and shifts AD to the left, and in a self-fulfilling prophecy, contributes to causing the recession that the president warned against in the first place. Figure 24.8 (b) shows a shift of AD to the left, and the corresponding movement of the equilibrium, from E0 to E1, to a lower quantity of output and a lower price level.
英語のヒント
消費者と企業の信頼感は、マクロ経済の現実を反映することが多い。例えば、経済が活発に成長しているとき信頼感は通常高く、景気後退中は低い。しかし、戦争の危険、選挙結果、外交上の出来事、著名人による将来の悲観的予測など、目の前の経済と密接に結びつかない理由でも、経済への信頼感が上下することがある。例えば米国大統領は、経済に関する公の発言に慎重でなければならない。経済への悲観を示すと、信頼感の低下を引き起こす危険がある。それが消費と投資を減らし、ADを左へシフトさせ、予言の自己実現として、もともと大統領が警告していた景気後退の発生に寄与する。図24.8(b)はADの左方シフトと、それに伴う均衡のE0からE1への移動を示す。生産量も物価水準も低くなる。
Additional Resources追加教材
Additional Resources追加教材
Shifts in Aggregate Demand総需要のシフト
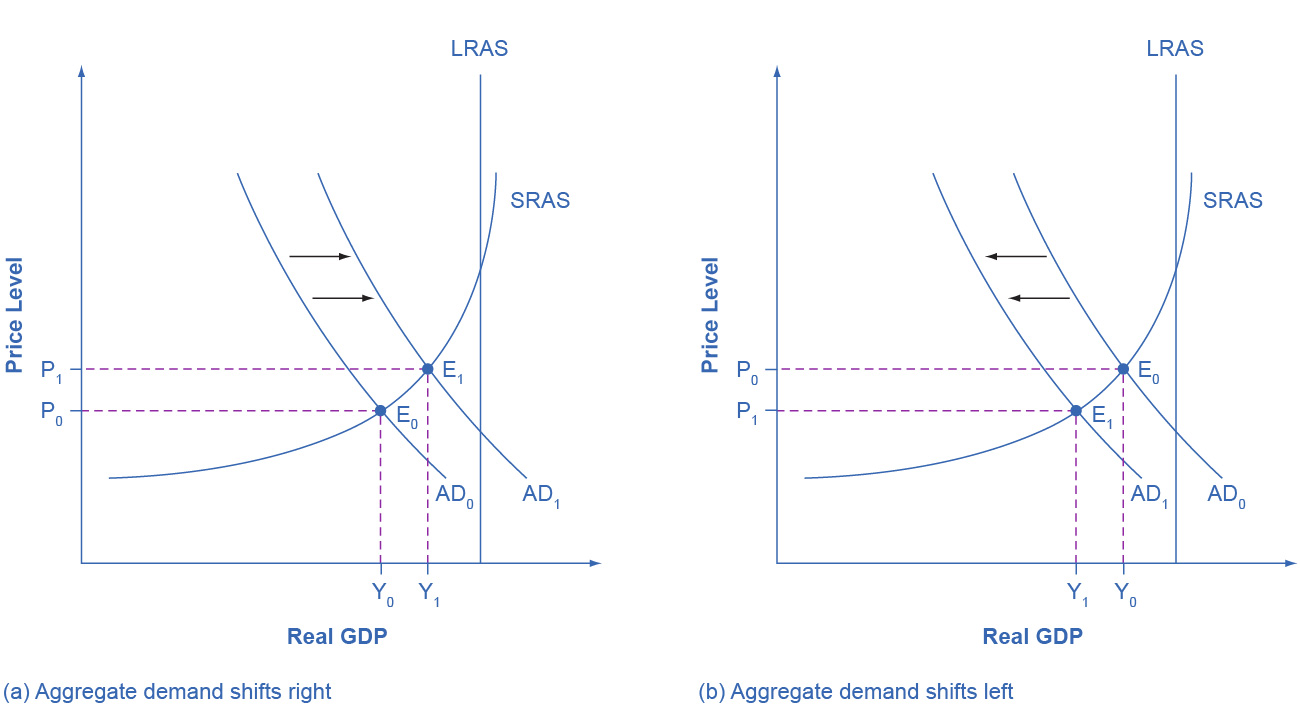

Figure 24.8図 24.8
(a) An increase in consumer confidence or business confidence can shift AD to the right, from AD0 to AD1. When AD shifts to the right, the new equilibrium (E1) will have a higher quantity of output and also a higher price level compared with the original equilibrium (E0). In this example, the new equilibrium (E1) is also closer to potential GDP. An increase in government spending or a cut in taxes that leads to a rise in consumer spending can also shift AD to the right. (b) A decrease in consumer confidence or business confidence can shift AD to the left, from AD0 to AD1. When AD shifts to the left, the new equilibrium (E1) will have a lower quantity of output and also a lower price level compared with the original equilibrium (E0). In this example, the new equilibrium (E1) is also farther below potential GDP. A decrease in government spending or higher taxes that leads to a fall in consumer spending can also shift AD to the left.
英語のヒント
(a)消費者や企業の信頼感が高まると、ADはAD0からAD1へ右にシフトしうる。ADが右へシフトすると、新しい均衡E1では元の均衡E0より生産量も物価水準も高くなる。この例では、新しい均衡E1は潜在GDPにも近づく。政府支出の増加や、消費支出を増やす減税も、ADを右へシフトさせうる。(b)消費者や企業の信頼感が低下すると、ADはAD0からAD1へ左にシフトしうる。ADが左へシフトすると、新しい均衡E1では元の均衡E0より生産量も物価水準も低くなる。この例では、新しい均衡E1は潜在GDPをさらに下回る。政府支出の減少や、消費支出を減らす増税も、ADを左へシフトさせうる。