第19章マクロ経済の視点
19.3 Tracking Real GDP over Time19.3 実質GDPの推移を追う
Learning Objectives学習目標
Learning Objectives学習目標
By the end of this section, you will be able to:
英語のヒント
この節を学ぶと、次のことができるようになる。
- Explain recessions, depressions, peaks, and troughs
英語のヒント
景気後退、恐慌、山、谷を説明する。 - Evaluate the importance of tracking real GDP over time
英語のヒント
実質GDPの時間的推移を追うことの重要性を検討する。
When news reports indicate that “the economy grew 1.2% in the first quarter,” the reports are referring to the percentage change in real GDP. By convention, governments report GDP growth at an annualized rate: Whatever the calculated growth in real GDP was for the quarter, we multiply it by four when it is reported as if the economy were growing at that rate for a full year.
英語のヒント
ニュースで「第1四半期に経済は1.2%成長した」と報じられるとき、それは実質GDPの変化率を指している。慣例により、政府はGDP成長率を年率で報告する。その四半期に計算された実質GDP成長率を4倍し、経済がそのペースで一年間成長したかのような率で公表するのである。
U.S. GDP, 1930–2020米国のGDP、1930~2020年
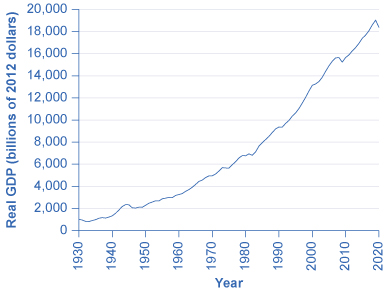

Figure 19.10図 19.10
Real GDP in the United States in 2020 (in 2012 dollars) was about $18.4 trillion. After adjusting to remove the effects of inflation, this represents a roughly 20-fold increase in the economy’s production of goods and services since 1930. (Source: bea.gov)
英語のヒント
2020年の米国の実質GDPは、2012年価格で約18.4兆ドルだった。インフレの影響を除く調整後の数値なので、これは1930年以来、経済の財・サービスの生産が約20倍になったことを表している。(出典:bea.gov)
Figure 19.10 shows the pattern of U.S. real GDP since 1930. Short term declines have regularly interrupted the generally upward long-term path of GDP. We call a significant decline in real GDP a recession. We call an especially lengthy and deep recession a depression. The severe drop in GDP that occurred during the 1930s Great Depression is clearly visible in the figure, as is the 2008–2009 Great Recession and the recession induced by COVID-19 in 2020.
英語のヒント
図19.10は、1930年以来の米国の実質GDPの推移を示している。GDPの長期的な経路はおおむね上向きだが、短期的な減少が定期的にそれを中断してきた。実質GDPの大幅な減少を景気後退という。特に長く深刻な景気後退を恐慌という。図では、1930年代の大恐慌中に起きたGDPの急落がはっきり見て取れる。2008~2009年の大不況と、2020年に新型コロナウイルス感染症によって起きた景気後退も同様である。
Real GDP is important because it is highly correlated with other measures of economic activity, like employment and unemployment. When real GDP rises, so does employment.
英語のヒント
実質GDPは、雇用や失業など他の経済活動の指標と強く相関するため、重要である。実質GDPが増えると、雇用も増える。
The most significant human problem associated with recessions (and their larger, uglier cousins, depressions) is that a slowdown in production means that firms need to lay off or fire some of their workers. Losing a job imposes painful financial and personal costs on workers, and often on their extended families as well. In addition, even those who keep their jobs are likely to find that wage raises are scanty at best—or their employers may ask them to take pay cuts.
英語のヒント
景気後退、そしてそのもっと大きく深刻な形である恐慌が引き起こす、人々にとって最も重大な問題は、生産の減速により企業が一部の労働者を一時解雇または解雇しなければならなくなることである。失職は、労働者に苦しい経済的・個人的な負担を課し、しばしば親族にまで及ぶ。さらに、仕事を保てた人でさえ、昇給があってもわずかだったり、雇用主から減給を求められたりする可能性が高い。
Table 19.9 lists the pattern of recessions and expansions in the U.S. economy since 1900. We call the highest point of the economy, before the recession begins, the peak. Conversely, the lowest point of a recession, before a recovery begins, is the trough. Thus, a recession lasts from peak to trough, and an economic upswing runs from trough to peak. We call the economy's movement from peak to trough and trough to peak the business cycle. It is intriguing to notice that the three longest trough-to-peak expansions of the twentieth century have happened since 1960. The most recent recession was caused by the COVID-19 pandemic. It started in February 2020 and ended formally in May 2020. This was the most severe recession since the 1930s Great Depression, but also the shortest. The previous recession, called the Great Recession, was also very severe and lasted about 18 months. The expansion starting in June 2009, the trough from the Great Recession, was the longest on record—ending 128 months with the pandemic-induced recession.
英語のヒント
表19.9は、1900年以来の米国経済の後退と拡大の推移をまとめたものである。景気後退が始まる前の経済の最高点を山という。逆に、回復が始まる前の景気後退の最低点を谷という。したがって、景気後退は山から谷まで続き、景気拡大は谷から山まで続く。山から谷、谷から山という経済の動きを景気循環という。20世紀における最長の三つの谷から山への拡大期が、いずれも1960年以降に起きているのは興味深い。最も最近の景気後退は、新型コロナウイルスのパンデミックによって起きた。2020年2月に始まり、正式には2020年5月に終わった。これは1930年代の大恐慌以来最も深刻な景気後退だったが、同時に最も短かった。その前の大不況と呼ばれる景気後退も非常に深刻で、約18か月続いた。大不況の谷である2009年6月から始まった拡大は、記録上最長だった。128か月続いた後、パンデミックによる景気後退で終わった。
Trough 谷 |
Peak 山 |
Months of Contraction 後退期間(月) |
Months of Expansion 拡大期間(月) |
|---|---|---|---|
December 1900 1900年12月 |
September 1902 1902年9月 |
18 |
21 |
August 1904 1904年8月 |
May 1907 1907年5月 |
23 |
33 |
June 1908 1908年6月 |
January 1910 1910年1月 |
13 |
19 |
January 1912 1912年1月 |
January 1913 1913年1月 |
24 |
12 |
December 1914 1914年12月 |
August 1918 1918年8月 |
23 |
44 |
March 1919 1919年3月 |
January 1920 1920年1月 |
7 |
10 |
July 1921 1921年7月 |
May 1923 1923年5月 |
18 |
22 |
July 1924 1924年7月 |
October 1926 1926年10月 |
14 |
27 |
November 1927 1927年11月 |
August 1929 1929年8月 |
23 |
21 |
March 1933 1933年3月 |
May 1937 1937年5月 |
43 |
50 |
June 1938 1938年6月 |
February 1945 1945年2月 |
13 |
80 |
October 1945 1945年10月 |
November 1948 1948年11月 |
8 |
37 |
October 1949 1949年10月 |
July 1953 1953年7月 |
11 |
45 |
May 1954 1954年5月 |
August 1957 1957年8月 |
10 |
39 |
April 1958 1958年4月 |
April 1960 1960年4月 |
8 |
24 |
February 1961 1961年2月 |
December 1969 1969年12月 |
10 |
106 |
November 1970 1970年11月 |
November 1973 1973年11月 |
11 |
36 |
March 1975 1975年3月 |
January 1980 1980年1月 |
16 |
58 |
July 1980 1980年7月 |
July 1981 1981年7月 |
6 |
12 |
November 1982 1982年11月 |
July 1990 1990年7月 |
16 |
92 |
March 1991 1991年3月 |
March 2001 2001年3月 |
8 |
120 |
November 2001 2001年11月 |
December 2007 2007年12月 |
8 |
73 |
January 2009 2009年1月 |
February 2020 2020年2月 |
2 |
128 |
April 2020 2020年4月 |
TBD 未定 |
TBD 未定 |
TBD 未定 |
A private think tank, the National Bureau of Economic Research (NBER), tracks business cycles for the U.S. economy. However, the effects of a severe recession often linger after the official ending date assigned by the NBER.
英語のヒント
民間のシンクタンクである全米経済研究所(NBER)は、米国経済の景気循環を追跡している。しかし、深刻な景気後退の影響は、NBERが定める公式な終了日の後も長く残ることが多い。