第19章マクロ経済の視点
19.1 Measuring the Size of the Economy: Gross Domestic Product19.1 経済規模の測定:国内総生産
Learning Objectives学習目標
Learning Objectives学習目標
By the end of this section, you will be able to:
英語のヒント
この節を学ぶと、次のことができるようになる。
- Identify the components of GDP on the demand side and on the supply side
英語のヒント
需要側と供給側から見たGDPの構成要素を特定する。 - Evaluate how economists measure gross domestic product (GDP)
英語のヒント
経済学者が国内総生産(GDP)をどう測るかを検討する。 - Contrast and calculate GDP, net exports, and net national product
英語のヒント
GDP、純輸出、国民純生産を対比し、計算する。
Macroeconomics is an empirical subject, so the first step toward understanding it is to measure the economy.
英語のヒント
マクロ経済学は実証的な学問である。そのため、理解への第一歩は経済を測定することである。
How large is the U.S. economy? Economists typically measure the size of a nation’s overall economy by its gross domestic product (GDP), which is the value of all final goods and services produced within a country in a given year. Measuring GDP involves counting the production of millions of different goods and services—smart phones, cars, music downloads, computers, steel, bananas, college educations, and all other new goods and services that a country produced in the current year—and summing them into a total dollar value. This task is straightforward: take the quantity of everything produced, multiply it by the price at which each product sold, and add up the total. In 2020, the U.S. GDP totaled $20.9 trillion, the largest GDP in the world.
英語のヒント
米国経済はどれほど大きいのだろうか。経済学者は通常、一国の経済全体の大きさを国内総生産(GDP)で測る。GDPとは、ある年に一国内で生産されたすべての最終財・サービスの価値である。GDPの測定では、スマートフォン、自動車、音楽のダウンロード、コンピューター、鉄鋼、バナナ、大学教育など、その国がその年に生産した何百万種類もの新しい財・サービスの生産量を数え、そのドル価値を合計する。作業の考え方は単純である。生産されたすべての品目について数量を求め、それぞれの販売価格を掛けて合計すればよい。2020年の米国のGDPは合計20.9兆ドルで、世界最大だった。
Each of the market transactions that enter into GDP must involve both a buyer and a seller. We can measure an economy's GDP either by the total dollar value of what consumers purchase in the economy, or by the total dollar value of what is the country produces. There is even a third way, as we will explain later.
英語のヒント
GDPに算入される市場取引には、必ず買い手と売り手の双方が存在する。ある経済のGDPは、その経済で消費者が購入するもののドル価値の総額でも、その国が生産するもののドル価値の総額でも測定できる。後で説明するように、さらに第三の方法もある。
GDP Measured by Components of Demand需要の構成要素から測るGDP
Who buys all of this production? We can divide this demand into four main parts: consumer spending (consumption), business spending (investment), government spending on goods and services, and spending on net exports. (See the following Clear It Up feature to understand what we mean by investment.) Table 19.1 shows how these four components added up to the GDP in 2020, Figure 19.4 (a) shows the levels of consumption, investment, and government purchases over time, expressed as a percentage of GDP, while Figure 19.4 (b) shows the levels of exports and imports as a percentage of GDP over time. A few patterns about each of these components are worth noticing. Table 19.1 shows the components of GDP from the demand side.
英語のヒント
Components of GDP on the Demand Side (in trillions of dollars) 需要側から見たGDPの構成要素(兆ドル) |
Percentage of Total 全体に占める割合 |
|
|---|---|---|
Consumption 消費 |
$14.0 |
67.2% |
Investment 投資 |
$3.6 |
17.4% |
Government 政府 |
$3.9 |
18.5% |
Exports 輸出 |
$2.1 |
10.2% |
Imports 輸入 |
–$2.7 |
–13.3% |
Total GDP GDP総額 |
$20.9 |
100% |
Percentage of Components of U.S. GDP on the Demand Side需要側から見た米国GDPの構成比
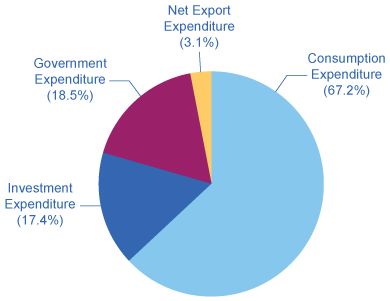
Figure 19.3図 19.3
Consumption makes up over half of the demand side components of the GDP. Totals in the chart do not add to 100% because the Net Export Expenditure, Exports minus Imports, is actually a negative 3.1%, as shown in Table 19.1. (Source: http://bea.gov/iTable/index_nipa.cfm, Table 1.1.10)
英語のヒント
消費は、GDPの需要側の構成要素の半分以上を占める。表19.1に示すように、輸出から輸入を差し引いた純輸出支出は実際にはマイナス3.1%なので、この図の数値を合計しても100%にはならない。(出典:http://bea.gov/iTable/index_nipa.cfm、表1.1.10)
Components of GDP on the Demand Side需要側から見たGDPの構成要素
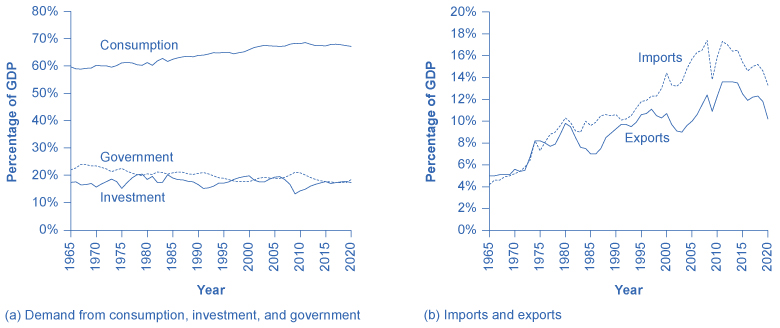


Figure 19.4図 19.4
(a) Consumption is about two-thirds of GDP, and it has been on a slight upward trend over time. Business investment hovers around 15% of GDP, but it fluctuates more than consumption. Government spending on goods and services is slightly under 20% of GDP and has declined modestly over time. (b) Exports are added to total demand for goods and services, while imports are subtracted from total demand. If exports exceed imports, as in most of the 1960s and 1970s in the U.S. economy, a trade surplus exists. If imports exceed exports, as in recent years, then a trade deficit exists. (Source: http://bea.gov/iTable/index_nipa.cfm, Table 1.1.10)
英語のヒント
(a)消費はGDPの約3分の2を占め、時間の経過とともにわずかな上昇傾向を示してきた。企業投資はGDPの15%前後で推移するが、消費より変動が大きい。財・サービスに対する政府支出はGDPの20%をやや下回り、時間の経過とともに緩やかに減少している。(b)輸出は財・サービスに対する総需要に加え、輸入は総需要から差し引く。1960年代と1970年代の米国経済の大半の時期のように輸出が輸入を上回ると、貿易黒字になる。近年のように輸入が輸出を上回ると、貿易赤字になる。(出典:http://bea.gov/iTable/index_nipa.cfm、表1.1.10)
Consumption expenditure by households is the largest component of GDP, accounting for about two-thirds of the GDP in any year. This tells us that consumers’ spending decisions are a major driver of the economy. However, consumer spending is a gentle elephant: when viewed over time, it does not jump around too much, and has increased modestly from about 60% of GDP in the 1960s and 1970s.
英語のヒント
家計の消費支出はGDPの最大の構成要素であり、どの年でもGDPのおよそ3分の2を占める。これは、消費者の支出の決定が経済を動かす主要な力であることを示している。ただし、消費者支出は「おとなしい象」である。時系列で見るとあまり激しく動かず、1960年代と1970年代のGDP比約60%から緩やかに増加してきた。
Investment expenditure refers to purchases of physical plant and equipment, primarily by businesses. If Starbucks builds a new store, or Amazon buys robots, they count these expenditures under business investment. Investment demand is far smaller than consumption demand, typically accounting for only about 15–18% of GDP, but it is very important for the economy because this is where jobs are created. However, it fluctuates more noticeably than consumption. Business investment is volatile. New technology or a new product can spur business investment, but then confidence can drop and business investment can pull back sharply.
英語のヒント
投資支出とは、主に企業による工場などの施設や設備の購入をいう。スターバックスが新店舗を建てたり、アマゾンがロボットを買ったりすれば、それらの支出は企業投資に数えられる。投資需要は消費需要よりはるかに小さく、通常はGDPの15~18%程度にすぎない。それでも、そこで雇用が生み出されるため、経済にとって非常に重要である。しかし、その変動は消費より目立つ。企業投資は不安定である。新技術や新製品が企業投資を刺激しても、その後に確信が失われれば、企業投資は急激に縮小することがある。
If you have noticed any of the infrastructure projects (new bridges, highways, airports) launched during the 2009 recession, or if you received a stimulus check during the pandemic-induced recession of 2020–2021, you have seen how important government spending can be for the economy. Government expenditure in the United States is close to 20% of GDP, and includes spending by all three levels of government: federal, state, and local. The only part of government spending counted in demand is government purchases of goods or services produced in the economy. Examples include the government buying a new fighter jet for the Air Force (federal government spending), building a new highway (state government spending), or a new school (local government spending). A significant portion of government budgets consists of transfer payments, like unemployment benefits, veteran’s benefits, and Social Security payments to retirees. The government excludes these payments from GDP because it does not receive a new good or service in return or exchange. Instead they are transfers of income from taxpayers to others. If you are curious about the awesome undertaking of adding up GDP, read the following Clear It Up feature.
英語のヒント
2009年の景気後退中に始まった新しい橋・高速道路・空港などのインフラ事業に気づいた人や、パンデミックによる2020~2021年の景気後退中に景気刺激策の給付金を受け取った人は、政府支出が経済にとっていかに重要になりうるかを目にしている。米国の政府支出はGDPの20%近くに達し、連邦・州・地方という三つの水準すべての政府の支出を含む。政府支出のうち需要に算入されるのは、その経済で生産された財・サービスを政府が購入する部分だけである。例として、空軍向けの新型戦闘機の購入(連邦政府支出)、新しい高速道路の建設(州政府支出)、新しい学校の建設(地方政府支出)が挙げられる。政府予算のかなりの部分は、失業給付、退役軍人給付、退職者への社会保障給付などの移転支出である。政府はこれらの支払いの見返りとして新しい財・サービスを受け取るわけではないため、GDPから除外する。それらは、納税者から他の人々への所得の移転である。GDPを合計するという膨大な作業に関心があれば、次の「疑問を解く」の囲みを読んでほしい。