第19章マクロ経済の視点
Figure 19.9 shows the U.S. nominal and real GDP since 1960. Because 2005 is the base year, the nominal and real values are exactly the same in that year. However, over time, the rise in nominal GDP looks much larger than the rise in real GDP (that is, the nominal GDP line rises more steeply than the real GDP line), because the presence of inflation, especially in the 1970s exaggerates the rise in nominal GDP.
英語のヒント
図19.9は、1960年以来の米国の名目GDPと実質GDPを示している。2005年が基準年なので、その年には名目値と実質値が正確に一致する。しかし時間の経過とともに、名目GDPの伸びは実質GDPの伸びよりはるかに大きく見える。つまり、名目GDPの線のほうが実質GDPの線より急に上がる。特に1970年代のインフレが、名目GDPの伸びを大きく見せるからである。
U.S. Nominal and Real GDP, 1960–2020米国の名目GDPと実質GDP、1960~2020年
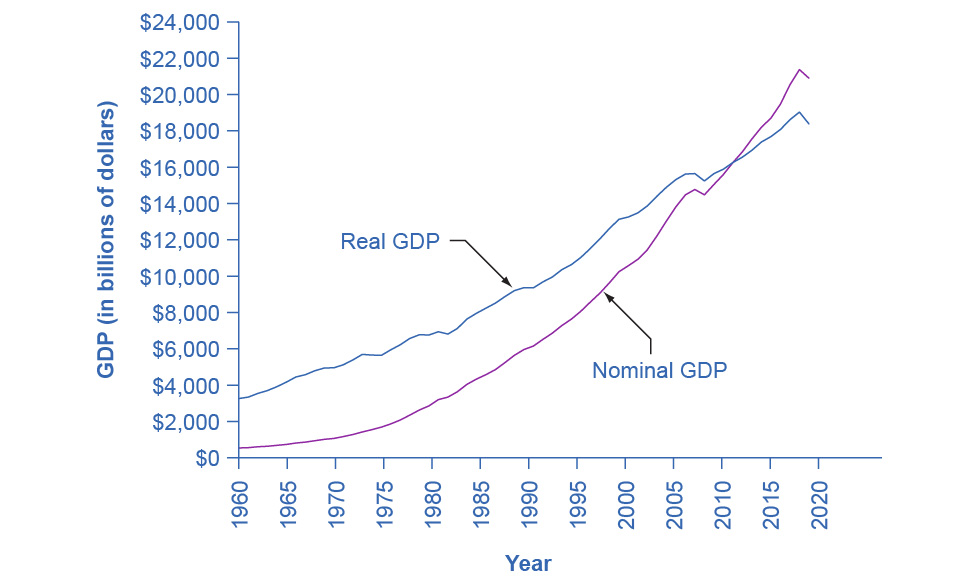

Figure 19.9図 19.9
The red line measures U.S. GDP in nominal dollars. The black line measures U.S. GDP in real dollars, where all dollar values are converted to 2012 dollars. Since we express real GDP in 2012 dollars, the two lines cross in 2012. However, real GDP will appear higher than nominal GDP in the years before 2012, because dollars were worth less in 2012 than in previous years. Conversely, real GDP will appear lower in the years after 2012, because dollars were worth more in 2012 than in later years.
英語のヒント
赤い線は米国のGDPを名目ドルで測ったものである。黒い線は実質ドルで測ったもので、すべてのドル価値を2012年ドルへ換算している。実質GDPを2012年ドルで表しているため、二つの線は2012年に交わる。2012年のドルはそれ以前の年より価値が低かったので、2012年より前は実質GDPのほうが名目GDPより高く見える。逆に、2012年のドルはそれ以後の年より価値が高かったので、2012年より後は実質GDPのほうが低く見える。
Let’s return to the question that we posed originally: How much did GDP increase in real terms? What was the real GDP growth rate from 1960 to 2020? To find the real growth rate, we apply the formula for percentage change:
英語のヒント
最初に立てた問いに戻ろう。GDPは実質でどれほど増えたのか。1960年から2020年までの実質GDP成長率はいくらだったのか。実質成長率を求めるには、変化率の式を適用する。
In other words, the U.S. economy has increased real production of goods and services by nearly a factor of five since 1960. Of course, that understates the material improvement since it fails to capture improvements in the quality of products and the invention of new products.
英語のヒント
言い換えれば、米国経済の財・サービスの実質生産は、1960年以来ほぼ5倍に増えた。ただし、これは製品の品質改善や新製品の発明を捉えていないため、物質的な向上を過小に示している。
There is a quicker way to answer this question approximately, using another math trick. Because:
英語のヒント
別の計算上の工夫を使えば、この問いにおおよその答えをより速く出す方法がある。次の関係が成り立つからである。
Therefore, real GDP growth rate (% change in quantity) equals the growth rate in nominal GDP (% change in value) minus the inflation rate (% change in price).
英語のヒント
したがって、実質GDP成長率、すなわち数量の変化率は、名目GDP成長率、すなわち価値の変化率から、インフレ率、すなわち価格の変化率を差し引いたものに等しい。
Note that using this equation provides an approximation for small changes in the levels. For more accurate measures, one should use the first formula.
英語のヒント
この式から得られるのは、水準の変化が小さい場合の近似であることに注意しよう。より正確に測定するには、最初の式を使うべきである。
Key Concepts and Summary重要概念とまとめ
The nominal value of an economic statistic is the commonly announced value. The real value is the value after adjusting for changes in inflation. To convert nominal economic data from several different years into real, inflation-adjusted data, the starting point is to choose a base year arbitrarily and then use a price index to convert the measurements so that economists measure them in the money prevailing in the base year.
英語のヒント
経済統計の名目値とは、通常公表される値である。実質値は、インフレの変化について調整した後の値である。複数の年の名目経済データを、インフレ調整済みの実質データへ換算するには、まず任意の基準年を選ぶ。次に物価指数を用いて数値を換算し、基準年に通用していた貨幣価値で測定する。
Self-Check Question理解度確認問題
Exercises 10練習問題 10
Exercise 10問題 10
Using data from Table 19.5 how much of the nominal GDP growth from 1980 to 1990 was real GDP and how much was inflation?
英語のヒント
表19.5のデータを用いて、1980年から1990年までの名目GDPの成長のうち、どれだけが実質GDPで、どれだけがインフレによるものだったかを求めよう。
Solution解き方
From 1980 to 1990, real GDP grew by (8,225.0 – 5,926.5) / (5,926.5) = 39%. Over the same period, prices increased by (72.7 – 48.3) / (48.3/100) = 51%. So about 57% of the growth 51 / (51 + 39) was inflation, and the remainder: 39 / (51 + 39) = 43% was growth in real GDP.
英語のヒント
1980年から1990年までに、実質GDPは(8,225.0 − 5,926.5) / 5,926.5 = 39%増えた。同じ期間に、物価は(72.7 − 48.3) / (48.3 / 100) = 51%上昇した。したがって、成長の約57%、すなわち51 / (51 + 39)がインフレによるもので、残りの39 / (51 + 39) = 43%が実質GDPの成長だった。
Review Questions復習問題
Exercises 11–12練習問題 11–12
Exercise 11問題 11
What is the difference between a series of economic data over time measured in nominal terms versus the same data series over time measured in real terms?
英語のヒント
名目で測った経済データの時系列と、同じデータを実質で測った時系列では、何が異なるか。
Exercise 12問題 12
How do you convert a series of nominal economic data over time to real terms?
英語のヒント
名目の経済時系列データを実質値に換算するには、どうすればよいか。
Critical Thinking Question考察問題
Exercises 13練習問題 13
Exercise 13問題 13
Should people typically pay more attention to their real income or their nominal income? If you choose the latter, why would that make sense in today’s world? Would your answer be the same for the 1970s?
英語のヒント
通常、人々は実質所得と名目所得のどちらにより注意を払うべきだろうか。後者を選ぶなら、それが今日の世界で理にかなうのはなぜか。1970年代についても同じ答えになるだろうか。
Problems問題
Exercises 14–15練習問題 14–15
Exercise 14問題 14
The “prime” interest rate is the rate that banks charge their best customers. Based on the nominal interest rates and inflation rates in Table 19.7, in which of the years would it have been best to be a lender? Based on the nominal interest rates and inflation rates in Table 19.7, in which of the years given would it have been best to be a borrower?
英語のヒント
Year 年 |
Prime Interest Rate プライム金利 |
Inflation Rate インフレ率 |
|---|---|---|
1970 |
7.9% |
5.7% |
1974 |
10.8% |
11.0% |
1978 |
9.1% |
7.6% |
1981 |
18.9% |
10.3% |
Exercise 15問題 15
A mortgage loan is a loan that a person makes to purchase a house. Table 19.8 provides a list of the mortgage interest rate for several different years and the rate of inflation for each of those years. In which years would it have been better to be a person borrowing money from a bank to buy a home? In which years would it have been better to be a bank lending money?
英語のヒント
住宅ローンとは、住宅を購入するために人が借りる融資である。表19.8は、いくつかの年の住宅ローン金利と各年のインフレ率を示している。住宅購入のため銀行から借りる人にとって、どの年がよりよかっただろうか。貸し出す銀行にとって、どの年がよりよかっただろうか。
Year 年 |
Mortgage Interest Rate 住宅ローン金利 |
Inflation Rate インフレ率 |
|---|---|---|
1984 |
12.4% |
4.3% |
1990 |
10% |
5.4% |
2001 |
7.0% |
2.8% |
nominal value
名目値
the economic statistic actually announced at that time, not adjusted for inflation; contrast with real value
英語のヒント
その時点で実際に公表された、インフレ調整をしていない経済統計。実質値と対比される。
real value
実質値
an economic statistic after it has been adjusted for inflation; contrast with nominal value
英語のヒント
インフレについて調整した後の経済統計。名目値と対比される。