第7章生産・費用・産業構造
The Size and Number of Firms in an Industry産業内の企業の規模と数
The shape of the long-run average cost curve has implications for how many firms will compete in an industry, and whether the firms in an industry have many different sizes, or tend to be the same size. For example, say that the appliance industry sells one million dishwashers every year at a price of $500 each and the long-run average cost curve for dishwashers is in Figure 7.11 (a). In Figure 7.11 (a), the lowest point of the LRAC curve occurs at a quantity of 10,000 produced. Thus, the market for dishwashers will consist of 100 different manufacturing plants of this same size. If some firms built a plant that produced 5,000 dishwashers per year or 25,000 dishwashers per year, the average costs of production at such plants would be well above $500, and the firms would not be able to compete.
英語のヒント
The LRAC Curve and the Size and Number of FirmsLRAC曲線と企業の規模・数
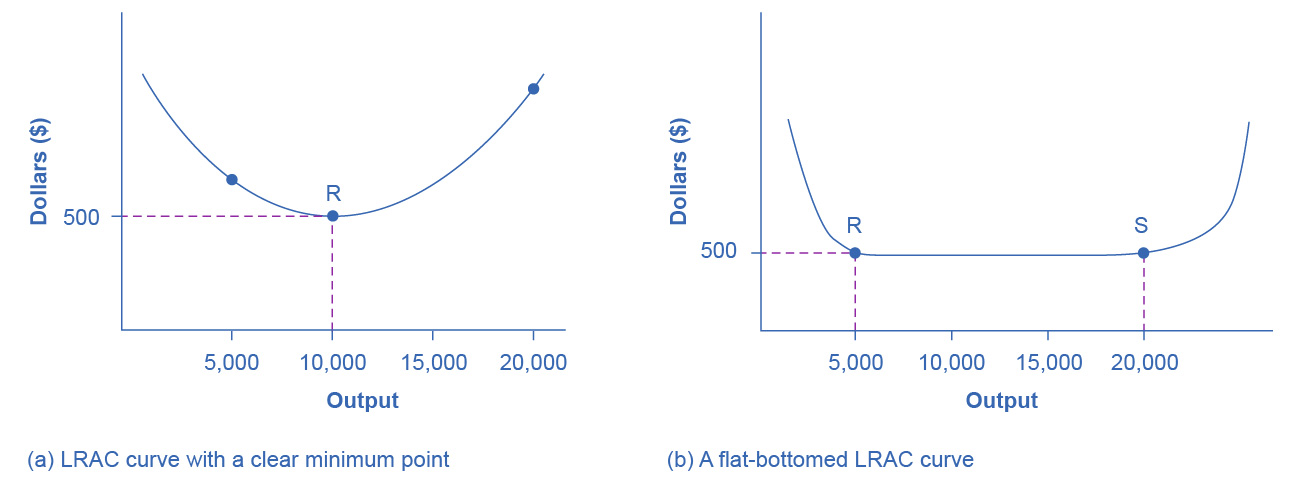

Figure 7.11図 7.11
(a) Low-cost firms will produce at output level R. When the LRAC curve has a clear minimum point, then any firm producing a different quantity will have higher costs. In this case, a firm producing at a quantity of 10,000 will produce at a lower average cost than a firm producing, say, 5,000 or 20,000 units. (b) Low-cost firms will produce between output levels R and S. When the LRAC curve has a flat bottom, then firms producing at any quantity along this flat bottom can compete. In this case, any firm producing a quantity between 5,000 and 20,000 can compete effectively, although firms producing less than 5,000 or more than 20,000 would face higher average costs and be unable to compete.
英語のヒント
(a)低費用の企業は産出量Rで生産する。LRAC曲線に明確な最小点があると、それ以外の数量を生産する企業の費用は高くなる。ここでは10,000単位を生産する企業の平均費用が、5,000や20,000単位の企業より低い。(b)低費用の企業はRからSの間で生産する。LRAC曲線の底が平らなら、その範囲のどの数量でも競争できる。ここでは5,000〜20,000単位を生産する企業は十分に競争できるが、5,000未満や20,000超の企業は平均費用が高く、競争できない。
We illustrate a more common case in Figure 7.11 (b), where the LRAC curve has a flat-bottomed area of constant returns to scale. In this situation, any firm with a level of output between 5,000 and 20,000 will be able to produce at about the same level of average cost. Given that the market will demand one million dishwashers per year at a price of $500, this market might have as many as 200 producers (that is, one million dishwashers divided by firms making 5,000 each) or as few as 50 producers (one million dishwashers divided by firms making 20,000 each). The producers in this market will range in size from firms that make 5,000 units to firms that make 20,000 units. However, firms that produce below 5,000 units or more than 20,000 will be unable to compete, because their average costs will be too high. Thus, if we see an industry where almost all plants are the same size, it is likely that the long-run average cost curve has a unique bottom point as in Figure 7.11 (a). However, if the long-run average cost curve has a wide flat bottom like Figure 7.11 (b), then firms of a variety of different sizes will be able to compete with each other.
英語のヒント
より一般的な場合を図7.11(b)に示す。LRAC曲線の底に、規模に関する収穫一定の平らな部分がある。この場合、5,000〜20,000単位を生産する企業は、ほぼ同じ平均費用で生産できる。1台500ドルで年100万台の需要があるなら、生産者数は多くて200社(100万台を各5,000台で割る)、少なくて50社(各20,000台で割る)になる。企業の規模は5,000台から20,000台まで幅がある。しかし5,000台未満や20,000台超の企業は、平均費用が高すぎて競争できない。したがって、ほぼすべての工場が同じ規模の産業なら、図7.11(a)のようにLRAC曲線に一つの最下点がある可能性が高い。図7.11(b)のように底が広く平らなら、異なる規模の企業が互いに競争できる。
We can interpret the flat section of the long-run average cost curve in Figure 7.11 (b) in two different ways. One interpretation is that a single manufacturing plant producing a quantity of 5,000 has the same average costs as a single manufacturing plant with four times as much capacity that produces a quantity of 20,000. The other interpretation is that one firm owns a single manufacturing plant that produces a quantity of 5,000, while another firm owns four separate manufacturing plants, which each produce a quantity of 5,000. This second explanation, based on the insight that a single firm may own a number of different manufacturing plants, is especially useful in explaining why the long-run average cost curve often has a large flat segment—and thus why a seemingly smaller firm may be able to compete quite well with a larger firm. At some point, however, the task of coordinating and managing many different plants raises the cost of production sharply, and the long-run average cost curve slopes up as a result.
英語のヒント
図7.11(b)の長期平均費用曲線の平らな部分には、二つの解釈がある。一つは、5,000単位を作る工場一つと、その4倍の能力で20,000単位を作る工場一つの平均費用が同じというものだ。もう一つは、ある企業は5,000単位の工場を一つ持ち、別の企業はそれぞれ5,000単位を作る工場を四つ持つというものだ。一社が複数の工場を所有できるという後者の考えは、長期平均費用曲線に広い平らな部分がある理由や、一見小さな企業でも大企業と十分に競争できる理由の説明に役立つ。ただし、ある段階では多数の工場の調整・管理で生産費用が急増し、長期平均費用曲線は右上がりになる。
In the examples to this point, the quantity demanded in the market is quite large (one million) compared with the quantity produced at the bottom of the long-run average cost curve (5,000, 10,000 or 20,000). In such a situation, the market is set for competition between many firms. However, what if the bottom of the long-run average cost curve is at a quantity of 10,000 and the total market demand at that price is only slightly higher than that quantity—or even somewhat lower?
英語のヒント
ここまでの例では、市場の需要量100万は、長期平均費用曲線の最下点の生産量5,000、10,000、20,000に比べて非常に大きい。この状況では、多数の企業が競争する。しかし、最下点が10,000で、その価格での市場需要がそれをわずかに上回る程度、あるいは下回る場合はどうなるだろうか。
Return to Figure 7.11 (a), where the bottom of the long-run average cost curve is at 10,000, but now imagine that the total quantity of dishwashers demanded in the market at that price of $500 is only 30,000. In this situation, the total number of firms in the market would be three. We call a handful of firms in a market an “oligopoly,” and the chapter on Monopolistic Competition and Oligopoly will discuss the range of competitive strategies that can occur when oligopolies compete.
英語のヒント
Alternatively, consider a situation, again in the setting of Figure 7.11 (a), where the bottom of the long-run average cost curve is 10,000, but total demand for the product is only 5,000. (For simplicity, imagine that this demand is highly inelastic, so that it does not vary according to price.) In this situation, the market may well end up with a single firm—a monopoly—producing all 5,000 units. If any firm tried to challenge this monopoly while producing a quantity lower than 5,000 units, the prospective competitor firm would have a higher average cost, and so it would not be able to compete in the longer term without losing money. The chapter on Monopoly discusses the situation of a monopoly firm.
英語のヒント
Thus, the shape of the long-run average cost curve reveals whether competitors in the market will be different sizes. If the LRAC curve has a single point at the bottom, then the firms in the market will be about the same size, but if the LRAC curve has a flat-bottomed segment of constant returns to scale, then firms in the market may be a variety of different sizes.
英語のヒント
このように、長期平均費用曲線の形を見ると、市場の競争相手の規模が異なるかどうかが分かる。最下点が一つなら企業はほぼ同規模になり、底に規模に関する収穫一定の平らな部分があれば、さまざまな規模の企業が存在し得る。
The relationship between the quantity at the minimum of the long-run average cost curve and the quantity demanded in the market at that price will predict how much competition is likely to exist in the market. If the quantity demanded in the market far exceeds the quantity at the minimum of the LRAC, then many firms will compete. If the quantity demanded in the market is only slightly higher than the quantity at the minimum of the LRAC, a few firms will compete. If the quantity demanded in the market is less than the quantity at the minimum of the LRAC, a single-producer monopoly is a likely outcome.
英語のヒント
長期平均費用曲線の最小点の数量と、その価格での市場需要量の関係から、競争の程度を予測できる。市場需要量が最小点の数量を大きく上回れば、多数の企業が競争する。わずかに上回るなら少数の企業、下回るなら生産者一社による独占になる可能性が高い。