第7章生産・費用・産業構造
Average Total Cost, Average Variable Cost, Marginal Cost平均総費用・平均可変費用・限界費用
The breakdown of total costs into fixed and variable costs can provide a basis for other insights as well. The first five columns of Table 7.10 duplicate the previous table, but the last three columns show average total costs, average variable costs, and marginal costs. These new measures analyze costs on a per-unit (rather than a total) basis and are reflected in the curves in Figure 7.8.
英語のヒント
Cost Curves at the Clip Jointクリップ・ジョイントの費用曲線
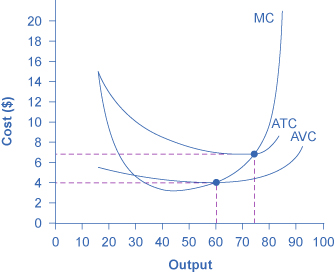

Figure 7.8図 7.8
We can also present the information on total costs, fixed cost, and variable cost on a per-unit basis. We calculate average total cost (ATC) by dividing total cost by the total quantity produced. The average total cost curve is typically U-shaped. We calculate average variable cost (AVC) by dividing variable cost by the quantity produced. The average variable cost curve lies below the average total cost curve and is also typically U-shaped. We calculate marginal cost (MC) by taking the change in total cost between two levels of output and dividing by the change in output. The marginal cost curve is upward-sloping.
英語のヒント
総費用、固定費用、可変費用は単位当たりでも示せる。平均総費用ATCは総費用を総生産量で割って求め、その曲線は通常U字形になる。平均可変費用AVCは可変費用を生産量で割ったもので、その曲線は平均総費用曲線の下に位置し、通常U字形になる。限界費用MCは二つの産出量の間の総費用の変化を産出量の変化で割って求め、その曲線は右上がりになる。
Labor 労働 |
Quantity 数量 |
Fixed Cost 固定費用 |
Variable Cost 可変費用 |
Total Cost 総費用 |
Marginal Cost 限界費用 |
Average Total Cost 平均総費用 |
Average Variable Cost 平均可変費用 |
|---|---|---|---|---|---|---|---|
1 |
16 |
$160 |
$80 |
$240 |
$15.00 |
$15.00 |
$5.00 |
2 |
40 |
$160 |
$160 |
$320 |
$3.33 |
$8.00 |
$4.00 |
3 |
60 |
$160 |
$240 |
$400 |
$4.00 |
$6.67 |
$4.00 |
4 |
72 |
$160 |
$320 |
$480 |
$6.67 |
$6.67 |
$4.44 |
5 |
80 |
$160 |
$400 |
$560 |
$10.00 |
$7.00 |
$5.00 |
6 |
84 |
$160 |
$480 |
$640 |
$20.00 |
$7.62 |
$5.71 |
Average total cost (sometimes referred to simply as average cost) is total cost divided by the quantity of output. Since the total cost of producing 40 haircuts is $320, the average total cost for producing each of 40 haircuts is $320/40, or $8 per haircut. Average cost curves are typically U-shaped, as Figure 7.8 shows. Average total cost starts off relatively high, because at low levels of output total costs are dominated by the fixed cost. Mathematically, the denominator is so small that average total cost is large. Average total cost then declines, as the fixed costs are spread over an increasing quantity of output. In the average cost calculation, the rise in the numerator of total costs is relatively small compared to the rise in the denominator of quantity produced. However, as output expands still further, the average cost begins to rise. At the right side of the average cost curve, total costs begin rising more rapidly as diminishing returns come into effect.
英語のヒント
平均総費用(単に平均費用ともいう)は、総費用を産出量で割ったものだ。40件の散髪の総費用は320ドルなので、1件当たりの平均総費用は320ドル/40=8ドルになる。図7.8のように、平均費用曲線は通常U字形だ。産出量が少ないと総費用に占める固定費用が大きいため、平均総費用は最初比較的高い。数学的には、分母が小さいために平均総費用が大きくなる。生産量が増えると、固定費用が多くの産出物に分散されるため、平均総費用は下がる。平均費用の計算で、分子の総費用の増加が、分母の生産量の増加に比べて小さいからだ。しかし、産出量がさらに増えると、平均費用は上がり始める。曲線の右側では、収穫逓減が働き、総費用がより速く増える。
We obtain average variable cost when we divide variable cost by quantity of output. For example, the variable cost of producing 80 haircuts is $400, so the average variable cost is $400/80, or $5 per haircut. Note that at any level of output, the average variable cost curve will always lie below the curve for average total cost, as Figure 7.8 shows. The reason is that average total cost includes average variable cost and average fixed cost. Thus, for Q = 80 haircuts, the average total cost is $7 per haircut, while the average variable cost is $5 per haircut. However, as output grows, fixed costs become relatively less important (since they do not rise with output), so average variable cost sneaks closer to average cost.
英語のヒント
平均可変費用は、可変費用を産出量で割って求める。80件の散髪の可変費用は400ドルなので、平均可変費用は400ドル/80=1件5ドルだ。図7.8のように、どの産出量でも平均可変費用曲線は平均総費用曲線の下に位置する。平均総費用には平均可変費用に加えて平均固定費用も含まれるためだ。Q=80件では、平均総費用は1件7ドル、平均可変費用は5ドルになる。しかし、産出量が増えても固定費用は増えないため、その相対的な重要性が小さくなり、平均可変費用は平均費用へ近づく。
Average total and variable costs measure the average costs of producing some quantity of output. Marginal cost is somewhat different. Marginal cost is the additional cost of producing one more unit of output. It is not the cost per unit of all units produced, but only the next one (or next few). We calculate marginal cost by taking the change in total cost and dividing it by the change in quantity. For example, as quantity produced increases from 40 to 60 haircuts, total costs rise by 400 – 320, or 80. Thus, the marginal cost for each of those marginal 20 units will be 80/20, or $4 per haircut. The marginal cost curve is generally upward-sloping, because diminishing marginal returns implies that additional units are more costly to produce. We can see small range of increasing marginal returns in the figure as a dip in the marginal cost curve before it starts rising. There is a point at which marginal and average costs meet, as the following Clear it Up feature discusses.
英語のヒント
平均総費用と平均可変費用は、ある量を生産する平均的な費用を測る。限界費用は少し異なり、1単位多く生産するときの追加費用である。生産した全単位の単位当たり費用ではなく、次の1単位、あるいは次の数単位だけの費用だ。総費用の変化を数量の変化で割って計算する。散髪が40件から60件へ増えると、総費用は400−320=80増える。追加の20件それぞれの限界費用は80/20=4ドルだ。限界費用曲線は一般に右上がりになる。限界収穫逓減の下では、追加の単位ほど生産費用が高くなるためだ。図で限界費用曲線が上昇前に少し下がる部分は、限界収穫が逓増する小さな範囲を表す。限界費用と平均費用が一致する点がある。次の「疑問を解く」で説明する。
The numerical calculations behind average cost, average variable cost, and marginal cost will change from firm to firm. However, the general patterns of these curves, and the relationships and economic intuition behind them, will not change.
英語のヒント
平均費用、平均可変費用、限界費用の具体的な数値は企業によって異なる。しかし、曲線の一般的な形、その関係、背後の経済的な考え方は変わらない。