第5章弾力性
Long-Run vs. Short-Run Impact長期と短期の影響
Elasticities are often lower in the short run than in the long run. On the demand side of the market, it can sometimes be difficult to change Qd in the short run, but easier in the long run. Consumption of energy is a clear example. In the short run, it is not easy for a person to make substantial changes in energy consumption. Maybe you can carpool to work sometimes or adjust your home thermostat by a few degrees if the cost of energy rises, but that is about all. However, in the long run you can purchase a car that gets more miles to the gallon, choose a job that is closer to where you live, buy more energy-efficient home appliances, or install more insulation in your home. As a result, the elasticity of demand for energy is somewhat inelastic in the short run, but much more elastic in the long run.
英語のヒント
弾力性は、長期より短期のほうが小さいことが多い。市場の需要側では、短期には需要量Qdを変えにくくても、長期には変えやすい場合がある。エネルギー消費が分かりやすい例だ。短期に個人がエネルギー消費を大幅に変えるのは容易ではない。費用が上がったとき、ときどき相乗りで通勤したり、自宅の温度調節器を数度変えたりできても、その程度だ。しかし長期には、燃費のよい車を買う、住まいに近い仕事を選ぶ、省エネ家電を買う、家の断熱を増すといった対応ができる。その結果、エネルギー需要は短期にはやや非弾力的だが、長期にははるかに弾力的になる。
Figure 5.11 is an example, based roughly on historical experience, for the responsiveness of Qd to price changes. In 1973, the price of crude oil was $12 per barrel and total consumption in the U.S. economy was 17 million barrels per day. That year, the nations who were members of the Organization of Petroleum Exporting Countries (OPEC) cut off oil exports to the United States for six months because the Arab members of OPEC disagreed with the U.S. support for Israel. OPEC did not bring exports back to their earlier levels until 1975—a policy that we can interpret as a shift of the supply curve to the left in the U.S. petroleum market. Figure 5.11 (a) and Figure 5.11 (b) show the same original equilibrium point and the same identical shift of a supply curve to the left from S0 to S1.
英語のヒント
How a Shift in Supply Can Affect Price or Quantity供給のシフトは価格と数量にどう影響するか
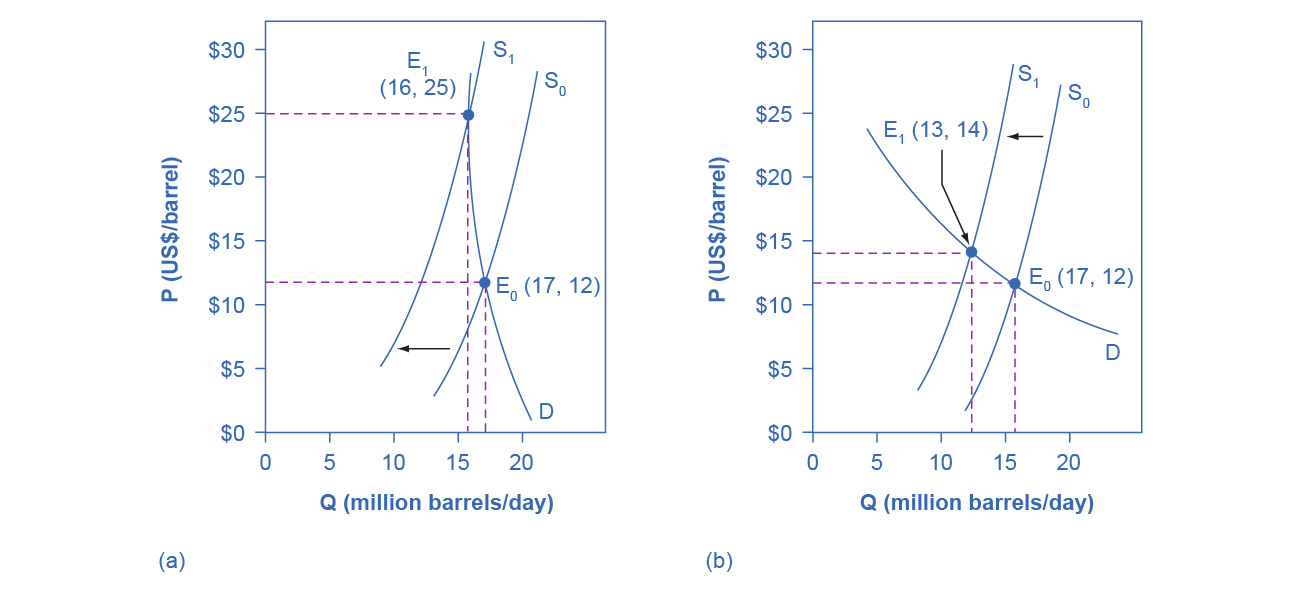

Figure 5.11図 5.11
The intersection (E0) between demand curve D and supply curve S0 is the same in both (a) and (b). The shift of supply to the left from S0 to S1 is identical in both (a) and (b). The new equilibrium (E1) has a higher price and a lower quantity than the original equilibrium (E0) in both (a) and (b). However, the shape of the demand curve D is different in (a) and (b), being more elastic in (b) than in (a). As a result, the shift in supply can result either in a new equilibrium with a much higher price and an only slightly smaller quantity, as in (a), with more inelastic demand, or in a new equilibrium with only a small increase in price and a relatively larger reduction in quantity, as in (b), with more elastic demand.
英語のヒント
需要曲線Dと供給曲線S0の交点E0は、(a)と(b)で同じである。S0からS1への供給の左方シフトも同じだ。新しい均衡E1は、どちらでも元の均衡E0より価格が高く、数量が少ない。しかし需要曲線Dの形が違い、(b)のほうが(a)より弾力的である。その結果、供給のシフトは、非弾力的な(a)では大幅な値上がりとわずかな数量減少を、弾力的な(b)では小幅な値上がりと比較的大きな数量減少を伴う新均衡を生む。
Figure 5.11 (a) shows inelastic demand for oil in the short run similar to that which existed for the United States in 1973. In Figure 5.11 (a), the new equilibrium (E1) occurs at a price of $25 per barrel, roughly double the price before the OPEC shock, and an equilibrium quantity of 16 million barrels per day. Figure 5.11 (b) shows what the outcome would have been if the U.S. demand for oil had been more elastic, a result more likely over the long term. This alternative equilibrium (E1) would have resulted in a smaller price increase to $14 per barrel and larger reduction in equilibrium quantity to 13 million barrels per day. In 1983, for example, U.S. petroleum consumption was 15.3 million barrels a day, which was lower than in 1973 or 1975. U.S. petroleum consumption was down even though the U.S. economy was about one-fourth larger in 1983 than it had been in 1973. The primary reason for the lower quantity was that higher energy prices spurred conservation efforts, and after a decade of home insulation, more fuel-efficient cars, more efficient appliances and machinery, and other fuel-conserving choices, the demand curve for energy had become more elastic.
英語のヒント
図5.11(a)は、1973年の米国に似た、短期の非弾力的な石油需要を示す。図5.11(a)の新しい均衡E1では、価格はOPECショック前の約2倍の1バレル25ドル、均衡数量は日量1,600万バレルになる。図5.11(b)は、米国の石油需要がより弾力的だったらどうなったかを示す。これは長期に起こりやすい。その場合の均衡E1では、価格上昇は小さく、1バレル14ドルとなり、均衡数量は大きく減って日量1,300万バレルになる。例えば1983年の米国の石油消費は日量1,530万バレルで、1973年や1975年より少なかった。1983年の米国経済は1973年より約4分の1大きかったにもかかわらず、石油消費は減っていた。主な理由は、エネルギー価格の上昇が節約を促したことだ。10年にわたり、住宅の断熱、燃費のよい車、効率的な家電や機械、その他の燃料節約策が進み、エネルギーの需要曲線はより弾力的になった。
On the supply side of markets, producers of goods and services typically find it easier to expand production in the long term of several years rather than in the short run of a few months. After all, in the short run it can be costly or difficult to build a new factory, hire many new workers, or open new stores. However, over a few years, all of these are possible.
英語のヒント
供給側では、財・サービスの生産者は通常、数か月の短期より、数年の長期のほうが増産しやすい。短期に新工場を建て、多数の労働者を雇い、新店舗を開くのは、費用がかかったり難しかったりする。しかし、数年あれば、これらはすべて可能になる。
In most markets for goods and services, prices bounce up and down more than quantities in the short run, but quantities often move more than prices in the long run. The underlying reason for this pattern is that supply and demand are often inelastic in the short run, so that shifts in either demand or supply can cause a relatively greater change in prices. However, since supply and demand are more elastic in the long run, the long-run movements in prices are more muted, while quantity adjusts more easily in the long run.
英語のヒント
多くの財・サービス市場では、短期には数量より価格が大きく上下するが、長期には価格より数量が大きく動くことが多い。需要と供給が短期には非弾力的なことが多く、どちらかのシフトが比較的大きな価格変化を生むためである。しかし、長期には需要と供給がより弾力的なので、価格変動は抑えられ、数量が調整されやすくなる。