第5章弾力性
5.2 Polar Cases of Elasticity and Constant Elasticity5.2 弾力性の両極端の場合と一定の弾力性
Learning Objectives学習目標
Learning Objectives学習目標
By the end of this section, you will be able to:
英語のヒント
この節を学ぶと、次のことができるようになる。
- Differentiate between infinite and zero elasticity
英語のヒント
弾力性が無限大の場合とゼロの場合を区別する。 - Analyze graphs in order to classify elasticity as constant unitary, infinite, or zero
英語のヒント
グラフを分析し、弾力性を一定の単位弾力性、無限弾力性、弾力性ゼロに分類する。
There are two extreme cases of elasticity: when elasticity equals zero and when it is infinite. A third case of interest is that of constant unitary elasticity. We will describe each case. Infinite elasticity or perfect elasticity refers to the extreme case where either the quantity demanded (Qd) or supplied (Qs) changes by an infinite amount in response to any change in price at all. In both cases, the supply and the demand curve are horizontal as Figure 5.4 shows. While perfectly elastic supply curves are for the most part unrealistic, goods with readily available inputs and whose production can easily expand will feature highly elastic supply curves. Examples include pizza, bread, books, and pencils. Similarly, perfectly elastic demand is an extreme example. However, luxury goods, items that take a large share of individuals’ income, and goods with many substitutes are likely to have highly elastic demand curves. Examples of such goods are Caribbean cruises and sports vehicles.
英語のヒント
弾力性には二つの極端な場合がある。ゼロの場合と無限大の場合だ。もう一つ興味深いのは、単位弾力性が一定の場合である。それぞれを説明しよう。無限弾力性、または完全弾力性とは、価格が少しでも変わると、需要量Qdまたは供給量Qsが無限に変わる極端な場合である。図5.4のように、どちらの場合も供給曲線と需要曲線は水平になる。完全に弾力的な供給曲線はほとんどの場合に非現実的だが、投入物がすぐ手に入り、容易に増産できる財は、非常に弾力的な供給曲線を持つ。ピザ、パン、本、鉛筆などである。同様に、完全に弾力的な需要も極端な例だ。しかし、ぜいたく品、個人の所得の大きな割合を占める品物、多くの代替品がある財は、非常に弾力的な需要曲線を持ちやすい。カリブ海クルーズやスポーツカーなどが例である。
Infinite Elasticity無限弾力性
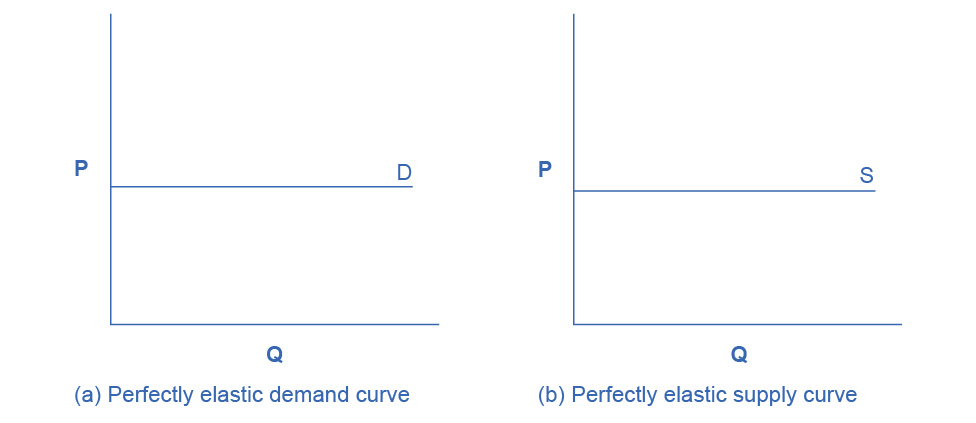
Figure 5.4図 5.4
The horizontal lines show that an infinite quantity will be demanded or supplied at a specific price. This illustrates the cases of a perfectly (or infinitely) elastic demand curve and supply curve. The quantity supplied or demanded is extremely responsive to price changes, moving from zero for prices close to P to infinite when prices reach P.
英語のヒント
水平線は、特定の価格で無限の数量が需要または供給されることを示す。完全に、または無限に弾力的な需要曲線と供給曲線である。供給量や需要量は価格変化に極めて敏感で、Pに近い価格でのゼロから、Pに達すると無限へ変わる。
Zero elasticity or perfect inelasticity, as Figure 5.5 depicts, refers to the extreme case in which a percentage change in price, no matter how large, results in zero change in quantity. While a perfectly inelastic supply is an extreme example, goods with limited supply of inputs are likely to feature highly inelastic supply curves. Examples include diamond rings or housing in prime locations such as apartments facing Central Park in New York City. Similarly, while perfectly inelastic demand is an extreme case, necessities with no close substitutes are likely to have highly inelastic demand curves. This is the case of life-saving drugs and gasoline.
英語のヒント
図5.5の弾力性ゼロ、または完全非弾力性とは、価格がどんなに大きな割合で変わっても、数量の変化はゼロになる極端な場合である。完全に非弾力的な供給は極端な例だが、投入物の供給が限られる財は、非常に非弾力的な供給曲線を持ちやすい。ダイヤモンドの指輪や、ニューヨークのセントラルパークに面するアパートのような一等地の住宅などが例である。同様に、完全に非弾力的な需要は極端だが、近い代替品のない必需品は、非常に非弾力的な需要曲線を持ちやすい。救命薬やガソリンがこれに当たる。
Zero Elasticity弾力性ゼロ
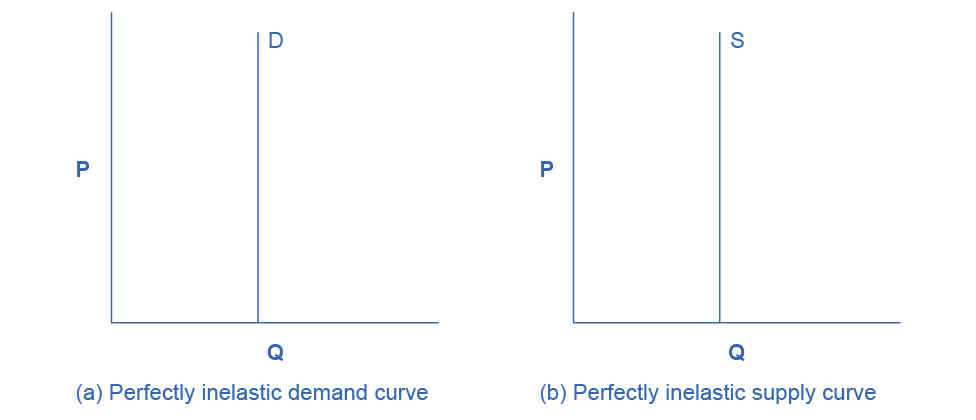
Figure 5.5図 5.5
The vertical supply curve and vertical demand curve show that there will be zero percentage change in quantity (a) demanded or (b) supplied, regardless of the price.
英語のヒント
垂直な需要曲線と供給曲線は、価格にかかわらず、(a)需要量または(b)供給量の変化率がゼロになることを示す。
Constant unitary elasticity, in either a supply or demand curve, occurs when a price change of one percent results in a quantity change of one percent. Figure 5.6 shows a demand curve with constant unit elasticity. Using the midpoint method, you can calculate that between points A and B on the demand curve, the price changes by 66.7% and quantity demanded also changes by 66.7%. Hence, the elasticity equals 1. Between points B and C, price again changes by 66.7% as does quantity, while between points C and D the corresponding percentage changes are again 66.7% for both price and quantity. In each case, then, the percentage change in price equals the percentage change in quantity, and consequently elasticity equals 1. Notice that in absolute value, the declines in price, as you step down the demand curve, are not identical. Instead, the price falls by $8.00 from A to B, by a smaller amount of $4.00 from B to C, and by a still smaller amount of $2.00 from C to D. As a result, a demand curve with constant unitary elasticity moves from a steeper slope on the left and a flatter slope on the right—and a curved shape overall.
英語のヒント
需要曲線でも供給曲線でも、価格の1%の変化が数量の1%の変化をもたらすとき、単位弾力性が一定になる。図5.6は、単位弾力性が一定の需要曲線を示す。中点法で計算すると、点AとBの間では価格が66.7%変わり、需要量も66.7%変わる。したがって弾力性は1である。BとCの間でも、価格と数量はともに66.7%変わる。CとDの間でも、両方の変化率は66.7%だ。どの場合も価格と数量の変化率が等しく、弾力性は1になる。需要曲線を下へ進むとき、価格下落の絶対額が同じではない点に注目しよう。AからBでは8ドル、BからCではそれより小さい4ドル、CからDではさらに小さい2ドル下がる。そのため、単位弾力性が一定の需要曲線は左側で急、右側で緩やかになり、全体として曲がった形になる。
A Constant Unitary Elasticity Demand Curve単位弾力性が一定の需要曲線
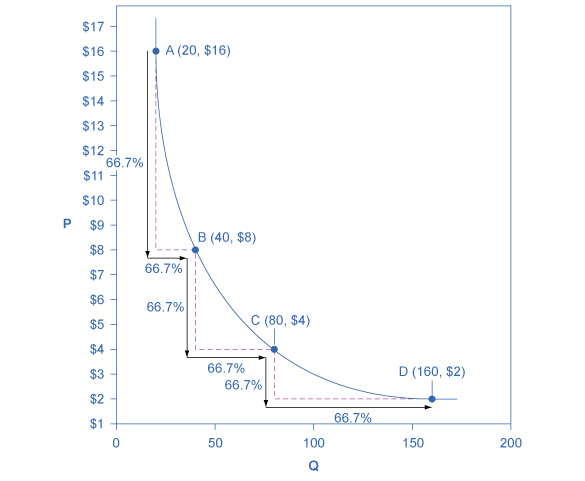
Figure 5.6図 5.6
A demand curve with constant unitary elasticity will be a curved line. Notice how price and quantity demanded change by an identical percentage amount between each pair of points on the demand curve.
英語のヒント
単位弾力性が一定の需要曲線は、曲がった線になる。曲線上の各点の組の間で、価格と需要量が同じ割合で変わることに注目しよう。
Unlike the demand curve with unitary elasticity, the supply curve with unitary elasticity is represented by a straight line, and that line goes through the origin. In each pair of points on the supply curve there is an equal difference in quantity of 30. However, in percentage value, using the midpoint method, the steps are decreasing as one moves from left to right, from 28.6% to 22.2% to 18.2%, because the quantity points in each percentage calculation are getting increasingly larger, which expands the denominator in the elasticity calculation of the percentage change in quantity.
英語のヒント
単位弾力性の需要曲線とは違い、単位弾力性の供給曲線は、原点を通る直線で表される。供給曲線上の各点の組の間では、数量の差は同じ30である。しかし、中点法を用いた百分率では、左から右へ進むにつれて28.6%、22.2%、18.2%と小さくなる。各計算で使う数量が次第に大きくなり、弾力性を求める際の数量の変化率の分母が大きくなるからである。
Consider the price changes moving up the supply curve in Figure 5.7. From points D to E to F and to G on the supply curve, each step of $1.50 is the same in absolute value. However, if we measure the price changes in percentage change terms, using the midpoint method, they are also decreasing, from 28.6% to 22.2% to 18.2%, because the original price points in each percentage calculation are getting increasingly larger in value, increasing the denominator in the calculation of the percentage change in price. Along the constant unitary elasticity supply curve, the percentage quantity increases on the horizontal axis exactly match the percentage price increases on the vertical axis—so this supply curve has a constant unitary elasticity at all points.
英語のヒント
図5.7の供給曲線を上へ進む際の価格変化を考えよう。点D、E、F、Gと進むと、各段階で1.50ドルずつ増え、絶対額は同じだ。だが、中点法を使って変化率で測ると、こちらも28.6%、22.2%、18.2%と小さくなる。各計算で使う元の価格が次第に大きくなり、価格の変化率の分母が大きくなるからである。単位弾力性が一定の供給曲線では、横軸の数量増加率が、縦軸の価格上昇率とぴったり一致する。したがって、この供給曲線はすべての点で単位弾力性が一定である。
A Constant Unitary Elasticity Supply Curve単位弾力性が一定の供給曲線
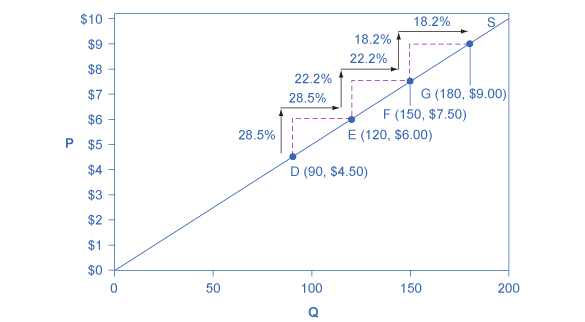


Figure 5.7図 5.7
A constant unitary elasticity supply curve is a straight line reaching up from the origin. Between each pair of points, the percentage increase in quantity supplied is the same as the percentage increase in price.
英語のヒント
単位弾力性が一定の供給曲線は、原点から右上へ伸びる直線である。各点の組の間で、供給量の増加率は価格の上昇率と等しい。