第5章弾力性
5.1 Price Elasticity of Demand and Price Elasticity of Supply5.1 需要の価格弾力性と供給の価格弾力性
Learning Objectives学習目標
Learning Objectives学習目標
By the end of this section, you will be able to:
英語のヒント
この節を学ぶと、次のことができるようになる。
- Calculate the price elasticity of demand
英語のヒント
需要の価格弾力性を計算する。 - Calculate the price elasticity of supply
英語のヒント
供給の価格弾力性を計算する。
Both the demand and supply curve show the relationship between price and the number of units demanded or supplied. Price elasticity is the ratio between the percentage change in the quantity demanded (Qd) or supplied (Qs) and the corresponding percent change in price. The price elasticity of demand is the percentage change in the quantity demanded of a good or service divided by the percentage change in the price. The price elasticity of supply is the percentage change in quantity supplied divided by the percentage change in price.
英語のヒント
需要曲線も供給曲線も、価格と需要量または供給量の関係を示す。価格弾力性は、需要量Qdまたは供給量Qsの変化率と、それに対応する価格の変化率の比である。需要の価格弾力性は、財・サービスの需要量の変化率を、価格の変化率で割ったものだ。供給の価格弾力性は、供給量の変化率を価格の変化率で割ったものである。
We can usefully divide elasticities into three broad categories: elastic, inelastic, and unitary. Because price and quantity demanded move in opposite directions, price elasticity of demand is always a negative number. Therefore, price elasticity of demand is usually reported as its absolute value, without a negative sign. The summary in Table 5.1 is assuming absolute values for price elasticity of demand. An elastic demand or elastic supply is one in which the elasticity is greater than one, indicating a high responsiveness to changes in price. Elasticities that are less than one indicate low responsiveness to price changes and correspond to inelastic demand or inelastic supply. Unitary elasticities indicate proportional responsiveness of either demand or supply, as Table 5.1 summarizes.
英語のヒント
If . . . 条件 |
Then . . . 弾力性 |
And It Is Called . . . 呼び方 |
|---|---|---|
Elastic 弾力的 |
||
Unitary 単位弾力的 |
||
Inelastic 非弾力的 |
Additional Resources追加教材
To calculate elasticity along a demand or supply curve economists use the average percent change in both quantity and price. This is called the Midpoint Method for Elasticity, and is represented in the following equations:
英語のヒント
経済学者は、需要曲線や供給曲線に沿った弾力性を計算するとき、数量と価格のどちらにも平均値を基準にした変化率を使う。これを弾力性の中点法と呼び、次の式で表す。
The advantage of the Midpoint Method is that one obtains the same elasticity between two price points whether there is a price increase or decrease. This is because the formula uses the same base (average quantity and average price) for both cases.
英語のヒント
中点法の利点は、価格が上がる場合も下がる場合も、二つの価格の間で同じ弾力性が得られることだ。どちらの場合も、式が同じ基準、つまり平均数量と平均価格を使うからである。
Calculating Price Elasticity of Demand需要の価格弾力性を計算する
Let’s calculate the elasticity between points A and B and between points G and H as Figure 5.2 shows.
英語のヒント
図5.2の点AとBの間、および点GとHの間の弾力性を計算しよう。
Calculating the Price Elasticity of Demand需要の価格弾力性の計算
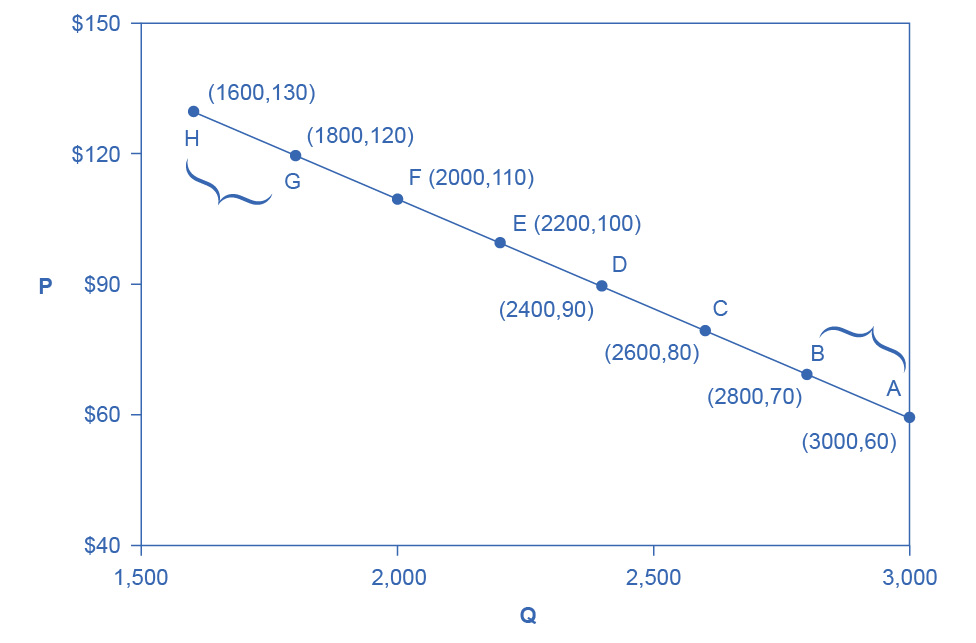

Figure 5.2図 5.2
We calculate the price elasticity of demand as the percentage change in quantity divided by the percentage change in price.
英語のヒント
需要の価格弾力性は、数量の変化率を価格の変化率で割って計算する。
First, apply the formula to calculate the elasticity as price decreases from $70 at point B to $60 at point A:
英語のヒント
まず、点Bの70ドルから点Aの60ドルへ価格が下がる場合について、式を使って弾力性を計算する。
Therefore, the elasticity of demand between these two points is which is 0.45, an amount smaller than one, showing that the demand is inelastic in this interval. Price elasticities of demand are always negative since price and quantity demanded always move in opposite directions (on the demand curve). By convention, we always talk about price elasticities of demand as positive numbers. Mathematically, we take the absolute value of the result. We will ignore this detail from now on, while remembering to interpret elasticities as positive numbers.
英語のヒント
したがって、この二点間の需要の弾力性は、つまり0.45である。1より小さいので、この区間では需要は非弾力的だ。需要曲線上では、価格と需要量は常に逆方向に動くため、需要の価格弾力性は常に負になる。慣例として、需要の価格弾力性は正の数で述べる。数学的には、結果の絶対値を取る。以降はこの細部を省くが、弾力性を正の数として解釈することを覚えておこう。
This means that, along the demand curve between point B and A, if the price changes by 1%, the quantity demanded will change by 0.45%. A change in the price will result in a smaller percentage change in the quantity demanded. For example, a 10% increase in the price will result in only a 4.5% decrease in quantity demanded. A 10% decrease in the price will result in only a 4.5% increase in the quantity demanded. Price elasticities of demand are negative numbers indicating that the demand curve is downward sloping, but we read them as absolute values. The following Work It Out feature will walk you through calculating the price elasticity of demand.
英語のヒント
これは、点BとAの間の需要曲線に沿って、価格が1%変わると、需要量が0.45%変わることを意味する。価格の変化は、それより小さい割合の需要量の変化をもたらす。例えば、10%値上がりすると、需要量は4.5%しか減らない。10%値下がりすると、需要量は4.5%しか増えない。需要の価格弾力性は負であり、需要曲線が右下がりであることを示すが、絶対値として読む。次の「考えてみよう」では、需要の価格弾力性の計算を順に進める。