第29章ビッグバンThe Big Bang
Properties of the Cosmic Microwave Background宇宙マイクロ波背景放射の性質
One issue that worried astronomers is that Penzias and Wilson were measuring the background radiation filling space through Earth’s atmosphere. What if that atmosphere is a source of radio waves or somehow affected their measurements? It would be better to measure something this important from space.
英語のヒント
天文学者が心配した点の一つは、ペンジアスとウィルソンが、空間を満たす背景放射を地球の大気越しに測っていたことだった。大気そのものが電波源だったり、何らかの形で測定に影響したりしていたらどうだろうか。これほど重要なものなら、宇宙から測るほうがよい。
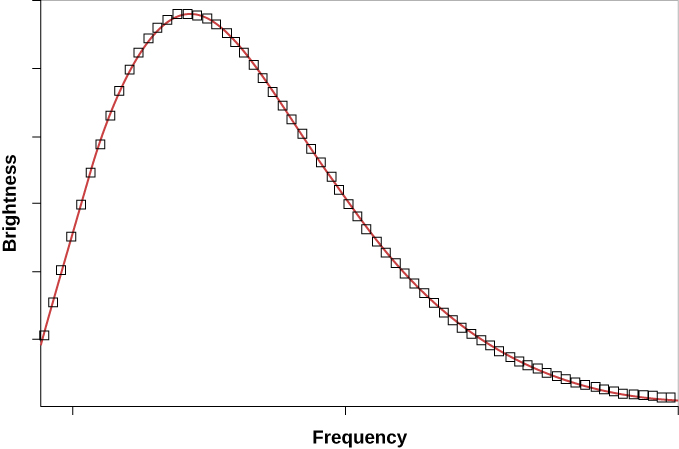
The first accurate measurements of the CMB were made with a satellite orbiting Earth. Named the Cosmic Background Explorer (COBE), it was launched by NASA in November 1989. The data it received quickly showed that the CMB closely matches that expected from a blackbody with a temperature of 2.73 K (Figure 29.17). This is exactly the result expected if the CMB was indeed redshifted radiation emitted by a hot gas that filled all of space shortly after the universe began.
英語のヒント
CMBの最初の精密な測定は、地球を回る衛星によって行われた。宇宙背景放射探査衛星COBEと名付けられ、NASAが1989年11月に打ち上げた。受信したデータはすぐに、CMBが2.73Kの黒体に予想される放射と、よく一致することを示した(図29.17)。これは、宇宙誕生後まもないころ、空間全体を満たした高温ガスが放った放射が赤方偏移したものこそCMBだとすれば、まさに予想される結果である。
Cosmic Background Radiation.宇宙背景放射。
OpenStax / Rice University · CC BY 4.0
Figure 29.17 The solid line shows how the intensity of radiation should change with frequency for a blackbody with a temperature of 2.73 K. The boxes show the intensity of the cosmic background radiation as measured at various frequencies by COBE’s instruments. The fit is perfect. When this graph was first shown at a meeting of astronomers, they gave it a standing ovation.
英語のヒント
図29.17 実線は、温度2.73Kの黒体で、放射の強度が周波数によってどう変わるはずかを示す。四角は、COBEの観測装置が各周波数で測った宇宙背景放射の強度である。両者は完全に一致する。このグラフが天文学者の会議で初めて示されたとき、会場の人々は立ち上がって拍手を送った。
The first important conclusion from measurements of the CMB, therefore, is that the universe we have today has indeed evolved from a hot, uniform state. This observation also provides direct support for the general idea that we live in an evolving universe, since the universe is cooler today than it was in the beginning.
したがって、CMBの測定から得られる第一の重要な結論は、現在の宇宙が、確かに高温で一様な状態から進化してきたということだ。宇宙は初めより今のほうが冷えているので、この観測は、私たちが変化する宇宙に住んでいるという考え自体も、直接支持している。
Small Differences in the CMBCMBのわずかな違い
It was known even before the launch of COBE that the CMB is extremely isotropic. In fact, its uniformity in every direction is one of the best confirmations of the cosmological principle— that the universe is homogenous and isotropic.
COBEが打ち上げられる前から、CMBが極めて等方的なことは知られていた。実際、どの方向でも同じという性質は、宇宙が一様かつ等方的であるという宇宙原理を確かめる、最良の証拠の一つである。
According to our theories, however, the temperature could not have been perfectly uniform when the CMB was emitted. After all, the CMB is radiation that was scattered from the particles in the universe at the time of decoupling. If the radiation were completely smooth, then all those particles must have been distributed through space absolutely evenly. Yet it is those particles that have become all the galaxies and stars (and astronomy students) that now inhabit the cosmos. Had the particles been completely smoothly distributed, they could not have formed all the large-scale structures now present in the universe—the clusters and superclusters of galaxies discussed in the last few chapters.
英語のヒント
しかし理論によれば、CMBが放たれたとき、温度は完全に一様ではありえなかった。CMBは、脱結合の時点で宇宙の粒子に散乱された放射である。放射にまったくむらがなかったなら、粒子も空間に完全に均等に分布していたはずだ。だが、その粒子こそが、今、宇宙にある銀河、恒星、そして天文学の学生になったのである。粒子が完全に均等に分布していたなら、ここ数章で論じた銀河団や超銀河団のような、現在の宇宙の大規模な構造を作れなかったはずだ。
The early universe must have had tiny density fluctuations from which such structures could evolve. Regions of higher-than-average density would have attracted additional matter and eventually grown into the galaxies and clusters that we see today. It turns out that these denser regions would appear to us to be colder spots, that is, they would have lower-than-average temperatures.
英語のヒント
初期宇宙には、こうした構造へ育つ、小さな密度のゆらぎがあったはずである。平均より密度の高い領域は、さらに物質を引き寄せ、やがて現在見える銀河や銀河団へ成長しただろう。こうした高密度の領域は、私たちには冷たい斑点、すなわち平均より低温の領域に見えることになる。
The reason that temperature and density are related can be explained this way. At the time of decoupling, photons in a slightly denser portion of space had to expend some of their energy to escape the gravitational force exerted by the surrounding gas. In losing energy, the photons became slightly colder than the overall average temperature at the time of decoupling. Vice versa, photons that were located in a slightly less dense portion of space lost less energy upon leaving it than other photons, thus appearing slightly hotter than average. Therefore, if the seeds of present-day galaxies existed at the time that the CMB was emitted, we should see some slight variations in the CMB temperature as we look in different directions in the sky.
英語のヒント
温度と密度が関係する理由は、次のように説明できる。脱結合のとき、やや高密度の領域にいた光子は、周囲のガスが及ぼす重力から逃れるために、エネルギーの一部を費やさなければならなかった。エネルギーを失った光子は、当時の全体の平均温度より、少し冷たくなった。反対に、やや低密度の領域にいた光子は、そこを離れるときに失うエネルギーが少なく、平均より少し熱く見える。したがって、CMBが放たれたときに、現在の銀河の種がすでにあったなら、空の方向を変えて見ると、CMBの温度にわずかな違いがあるはずだ。
Scientists working with the data from the COBE satellite did indeed detect very subtle temperature differences—about 1 part in 100,000—in the CMB. The regions of lower-than-average temperature come in a variety of sizes, but even the smallest of the colder areas detected by COBE is far too large to be the precursor of an individual galaxy, or even a supercluster of galaxies. This is because the COBE instrument had “blurry vision” (poor resolution) and could only measure large patches of the sky. We needed instruments with “sharper vision.”
英語のヒント
COBE衛星のデータを扱った科学者は、CMBに約10万分の1という、極めて微妙な温度差を実際に検出した。平均より低温の領域にはさまざまな大きさがあるが、COBEが検出した最小の領域でさえ、個々の銀河はもちろん、超銀河団のもとになる領域としても大きすぎる。それは、COBEの装置の「目がぼやけて」、分解能が低く、空の大きな区画しか測れなかったためである。もっと「目の鋭い」装置が必要だった。
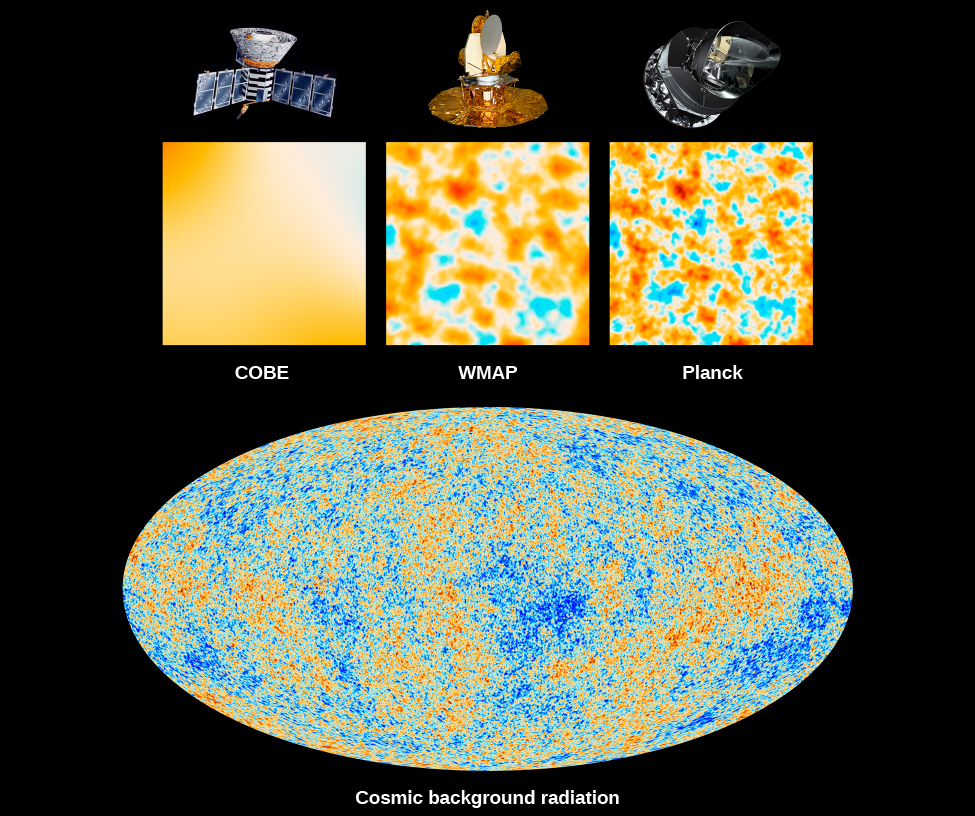
The most detailed measurements of the CMB have been obtained by two satellites launched more recently than COBE. The results from the first of these satellites, the Wilkinson Microwave Anisotropy Probe (WMAP) spacecraft, were published in 2003. In 2015, measurements from the Planck satellite extended the WMAP measurements to even-higher spatial resolution and lower noise (Figure 29.18).
英語のヒント
CMBの最も詳しい測定は、COBEより後に打ち上げられた二つの衛星によって得られた。最初の衛星、ウィルキンソン・マイクロ波異方性探査機WMAPの結果は2003年に発表された。2015年にはプランク衛星の測定が、WMAPより高い空間分解能と低い雑音で観測を進めた(図29.18)。
CMB Observations.CMBの観測。
credit top: modification of work by NASA/JPL-Caltech/ESA; credit bottom: modification of work by ESA and the Planck Collaboration · JPL image use policy
Figure 29.18 This comparison shows how much detail can be seen in the observations of three satellites used to measure the CMB. The CMB is a snapshot of the oldest light in our universe, imprinted on the sky when the universe was just about 380,000 years old. The first spacecraft, launched in 1989, is NASA’s Cosmic Background Explorer, or COBE. WMAP was launched in 2001, and Planck was launched in 2009. The three panels show 10-square-degree patches of all-sky maps. This cosmic background radiation image (bottom) is an all-sky map of the CMB as observed by the Planck mission. The colors in the map represent different temperatures: red for warmer and blue for cooler. These tiny temperature fluctuations correspond to regions of slightly different densities, representing the seeds of all future structures: the stars, galaxies, and galaxy clusters of today. (credit top: modification of work by NASA/JPL-Caltech/ESA; credit bottom: modification of work by ESA and the Planck Collaboration)
英語のヒント
図29.18 CMBを測定した三つの衛星で、見える細部がどれほど異なるかを比べている。CMBは、宇宙が約38万歳だったころに空へ刻まれた、最も古い光のスナップ写真である。最初の探査機はNASAの宇宙背景放射探査衛星COBEで、1989年に打ち上げられた。WMAPは2001年、プランクは2009年に打ち上げられた。上の三枚は、全天地図の10平方度の領域を示す。下の宇宙背景放射の画像は、プランクが観測したCMBの全天地図である。色は温度の違いを表し、赤は高温、青は低温を示す。この微小な温度ゆらぎは、少しずつ密度の違う領域に対応する。それらは後のあらゆる構造、すなわち今日の恒星、銀河、銀河団の種だった。(上のクレジット:NASA/JPL-Caltech/ESAの作品を改変。下のクレジット:ESA、Planck Collaborationの作品を改変)
Theoretical calculations show that the sizes of the hot and cold spots in the CMB depend on the geometry of the universe and hence on its total density. (It’s not at all obvious that it should do so, and it takes some pretty fancy calculations—way beyond the level of our text—to make the connection, but having such a dependence is very useful.) The total density we are discussing here includes both the amount of mass in the universe and the mass equivalent of the dark energy. That is, we must add together mass and energy: ordinary matter, dark matter, and the dark energy that is speeding up the expansion.
英語のヒント
理論計算によれば、CMBの高温・低温の斑点の大きさは宇宙の幾何学的な形に、したがって全密度に依存する。これは決して自明な関係ではない。結び付けるには、本書の水準をはるかに超える相当に高度な計算が必要だが、この依存関係があることは非常に役立つ。ここで扱う全密度には、宇宙の質量と、暗黒エネルギーの質量換算分の両方を含める。つまり、通常の物質、暗黒物質、膨張を加速させる暗黒エネルギーを、質量とエネルギーとして合わせなければならない。
To see why this works, remember (from the chapter on Black Holes and Curved Spacetime) that with his general theory of relativity, Einstein showed that matter can curve space and that the amount of curvature depends on the amount of matter present. Therefore, the total amount of matter in the universe (including dark matter and the equivalent matter contribution by dark energy), determines the overall geometry of space. Just like the geometry of space around a black hole has a curvature to it, so the entire universe may have a curvature. Let’s take a look at the possibilities (Figure 29.19).
英語のヒント
これがなぜ成り立つか、「ブラックホールと曲がった時空」を思い出そう。アインシュタインは一般相対性理論で、物質は空間を曲げることができ、曲がりの大きさは存在する物質の量に依存すると示した。したがって、暗黒物質と暗黒エネルギーの質量換算分を含む宇宙の物質の総量が、空間全体の幾何学的な形を決める。ブラックホールの周囲の空間に曲がりがあるのと同じように、宇宙全体にも曲がりがあるかもしれない。どんな可能性があるか見てみよう(図29.19)。
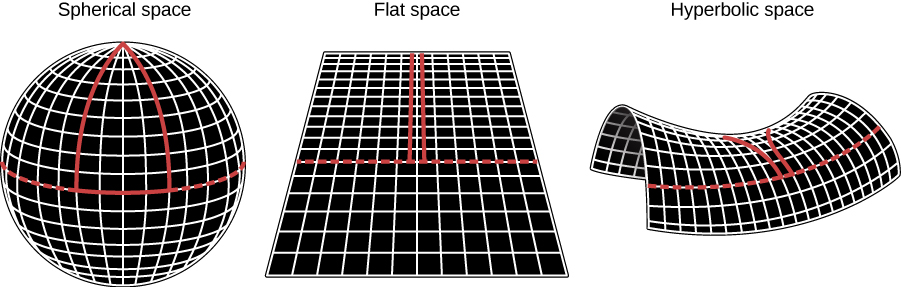
If the density of matter is higher than the critical density, the universe will eventually collapse. In such a closed universe, two initially parallel rays of light will eventually meet. This kind of geometry is referred to as spherical geometry. If the density of matter is less than critical, the universe will expand forever. Two initially parallel rays of light will diverge, and this is referred to as hyperbolic geometry. In a critical-density universe, two parallel light rays never meet, and the expansion comes to a halt only at some time infinitely far in the future. We refer to this as a flat universe, and the kind of Euclidean geometry you learned in high school applies in this type of universe.
英語のヒント
物質の密度が臨界密度より高ければ、宇宙はいずれ再び潰れる。そのような閉じた宇宙では、初めは平行だった2本の光線が、やがて出会う。この幾何学を球面幾何学と呼ぶ。物質の密度が臨界値より低ければ、宇宙は永遠に膨張する。初めは平行だった2本の光線は離れ合い、これは双曲幾何学と呼ばれる。臨界密度の宇宙では、平行な2本の光線は決して出会わず、膨張は無限に遠い未来にだけ停止へ近づく。これを平坦な宇宙と呼ぶ。この型の宇宙には、高校で学ぶユークリッド幾何学が当てはまる。
Picturing Space Curvature for the Entire Universe.宇宙全体の空間の曲がりを描く。
OpenStax / Rice University · CC BY 4.0
Figure 29.19 The density of matter and energy determines the overall geometry of space. If the density of the universe is greater than the critical density, then the universe will ultimately collapse and space is said to be closed like the surface of a sphere. If the density exactly equals the critical density, then space is flat like a sheet of paper; the universe will expand forever, with the rate of expansion coming to a halt infinitely far in the future. If the density is less than critical, then the expansion will continue forever and space is said to be open and negatively curved like the surface of a saddle (where more space than you expect opens up as you move farther away). Note that the red lines in each diagram show what happens in each kind of space—they are initially parallel but follow different paths depending on the curvature of space. Remember that these drawings are trying to show how space for the entire universe is “warped”—this can’t be seen locally in the small amount of space that we humans occupy.
英語のヒント
図29.19 物質とエネルギーの密度が、空間全体の幾何学的な形を決める。宇宙の密度が臨界密度より高ければ、宇宙はいずれ潰れ、空間は球面のように閉じていると言う。密度が臨界密度と等しければ、空間は紙のように平坦で、宇宙は永遠に膨張しながら、無限に遠い未来に膨張の速さがゼロへ近づく。密度が臨界値より低ければ、膨張は永遠に続き、空間は開いていて、鞍の表面のように負に曲がっていると言う。その場合、遠くへ進むほど、予想以上の空間が広がる。各図の赤線は、初めは平行な線が、空間の曲がりによって異なる道をたどる様子を示す。これらは、宇宙全体の空間がどう「ゆがんでいるか」を表そうとした図である。人間が占めるわずかな空間を局所的に見ても、この曲がりはわからない。
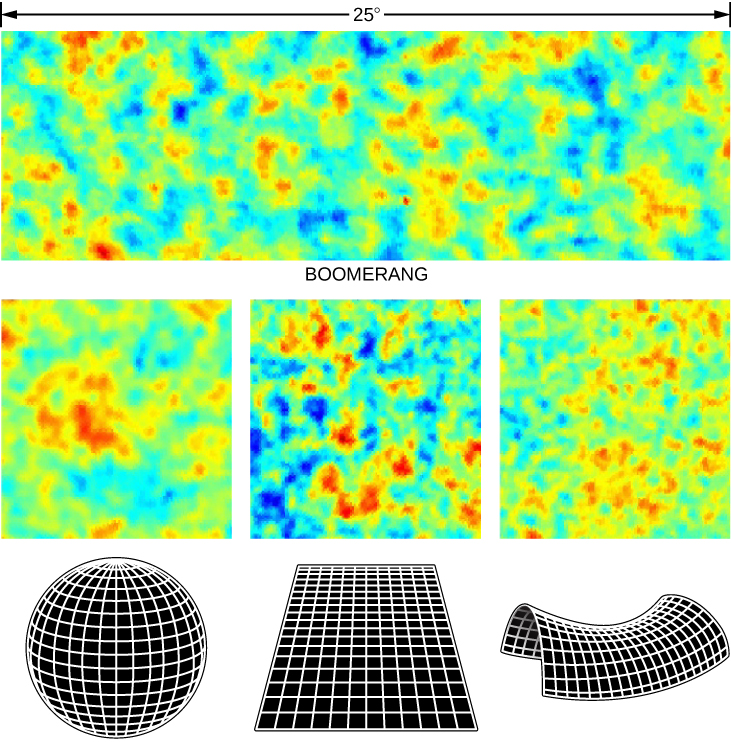
If the density of the universe is equal to the critical density, then the hot and cold spots in the CMB should typically be about a degree in size. If the density is greater than critical, then the typical sizes will be larger than one degree. If the universe has a density less than critical, then the structures will appear smaller. In Figure 29.20, you can see the differences easily. WMAP and Planck observations of the CMB confirmed earlier experiments that we do indeed live in a flat, critical-density universe.
宇宙の密度が臨界密度に等しければ、CMBの高温・低温の斑点の典型的な大きさは、約1度になるはずだ。臨界密度を上回れば1度より大きく、下回れば小さく見える。図29.20では、その違いがよくわかる。WMAPとプランクのCMB観測は、私たちが平坦な臨界密度の宇宙に住んでいるという、先行する実験の結果を確認した。
Comparison of CMB Observations with Possible Models of the Universe.CMB観測と、考えられる宇宙モデルの比較。
credit: modification of work by NASA · NASA media use guidelines
Figure 29.20 Cosmological simulations predict that if our universe has critical density, then the CMB images will be dominated by hot and cold spots of around one degree in size (bottom center). If, on the other hand, the density is higher than critical (and the universe will ultimately collapse), then the images’ hot and cold spots will appear larger than one degree (bottom left). If the density of the universe is less than critical (and the expansion will continue forever), then the structures will appear smaller (bottom right). As the measurements show, the universe is at critical density. The measurements shown were made by a balloon-borne instrument called BOOMERanG (Balloon Observations of Millimetric Extragalactic Radiation and Geophysics), which was flown in Antarctica. Subsequent satellite observations by WMAP and Planck confirm the BOOMERanG result. (credit: modification of work by NASA)
英語のヒント
図29.20 宇宙論のシミュレーションによれば、宇宙が臨界密度なら、CMB画像では約1度の高温・低温の斑点が目立つはずである(下中央)。臨界密度より高く、宇宙がいずれ再び潰れる場合、斑点は1度より大きく見える(下左)。臨界密度より低く、永久に膨張する場合、構造は小さく見える(下右)。測定結果は、宇宙が臨界密度にあることを示す。ここに示す測定は、南極で飛行した気球搭載の観測装置BOOMERanGによる。名前は「ミリ波の銀河系外放射と地球物理の気球観測」の略である。その後のWMAPとプランクの衛星観測も、BOOMERanGの結果を確認した。(クレジット:NASAの作品を改変)
Key numbers from an analysis of the Planck data give us the best values currently available for some of the basic properties of the universe:
プランクのデータ解析から得られた主要な値は、宇宙の基本的な性質のいくつかについて、現在得られる最良の値を与えている。
Age of universe: billion years (Note: That means we know the age of the universe to within 38 million years. Amazing!)
宇宙の年齢:(10億年単位)。つまり、宇宙の年齢が3800万年以内の精度でわかっている。驚くべき精度である。
Hubble constant: kilometers/second/million parsecs (in the units we’ve been using, 20.65 kilometers/second/million light-years)
ハッブル定数:km/s/100万パーセク。本書で使ってきた単位では、100万光年当たり毎秒20.65km。
Fraction of universe’s content that is “dark energy”:
宇宙の構成成分のうち「暗黒エネルギー」の割合:
Fraction of the universe’s content that is matter:
宇宙の構成成分のうち物質の割合:
Note that this value for the Hubble constant is slightly smaller than the value of 70 kilometers/second/million parsecs that we have adopted in this book. In fact, the value derived from measurements of redshifts is 73 kilometers/second/million parsecs. So precise is modern cosmology these days that scientists are working hard to resolve this discrepancy. The fact that the difference between these two independent measurements is so small is actually a remarkable achievement. Only a few decades ago, astronomers were arguing about whether the Hubble constant was around 50 kilometers/second/million parsecs or 100 kilometers/second/million parsecs.
英語のヒント
このハッブル定数は、本書で採用した70km/s/100万パーセクより、少し小さいことに注意しよう。実際、赤方偏移の測定から得られる値は73km/s/100万パーセクである。現代の宇宙論は、この食い違いを解消するために科学者が懸命に取り組むほど、精密になっている。二つの独立した測定の違いがこれほど小さいこと自体、実は目覚ましい成果だ。ほんの数十年前には、ハッブル定数は50km/s/100万パーセクなのか、それとも100km/s/100万パーセクなのか、天文学者が議論していたのである。
Analysis of Planck data also shows that ordinary matter (mainly protons and neutrons) makes up 4.9% of the total density. Dark matter plus normal matter add up to 31.5% of the total density. Dark energy contributes the remaining 68.5%. The age of the universe at decoupling—that is, when the CMB was emitted—was 380,000 years.
プランクのデータ解析は、主に陽子と中性子からなる通常の物質が、全密度の4.9%を占めることも示した。暗黒物質と通常の物質を合わせると31.5%、残る68.5%は暗黒エネルギーである。脱結合時、すなわちCMBが放たれた時点の宇宙年齢は、38万年だった。
Perhaps the most surprising result from the high-precision measurements by WMAP and the even higher-precision measurements from Planck is that there were no surprises. The model of cosmology with ordinary matter at about 5%, dark matter at about 25%, and dark energy about 70% has survived since the late 1990s when cosmologists were forced in that direction by the supernovae data. In other words, the very strange universe that we have been describing, with only about 5% of its contents being made up of the kinds of matter we are familiar with here on Earth, really seems to be the universe we live in.
英語のヒント
WMAPの高精度の測定と、さらに精度を上げたプランクの測定で最も驚くべき結果は、意外な結果がなかったことかもしれない。通常の物質が約5%、暗黒物質が約25%、暗黒エネルギーが約70%というモデルは、超新星のデータによって宇宙論研究者がこの方向へ導かれた1990年代末から、生き残ってきた。言い換えれば、中身のわずか5%ほどしか地球で馴染みのある物質でできていないという、ここまで説明してきた非常に奇妙な宇宙こそが、実際に私たちの住む宇宙らしいのである。
After the CMB was emitted, the universe continued to expand and cool off. By 300 to 400 million years after the Big Bang, the very first stars and galaxies had already formed. Deep in the interiors of stars, matter was reheated, nuclear reactions were ignited, and the more gradual synthesis of the heavier elements that we have discussed throughout this book began.
英語のヒント
CMBが放たれた後も、宇宙は膨張して冷え続けた。ビッグバンから3〜4億年後までには、最初の恒星と銀河がすでに形成されていた。恒星の奥深くでは物質が再び熱せられ、核反応が始まり、本書を通して論じてきた重い元素の、よりゆっくりした合成が始まった。
We conclude this quick tour of our model of the early universe with a reminder. You must not think of the Big Bang as a localized explosion in space, like an exploding superstar. There were no boundaries and there was no single site where the explosion happened. It was an explosion of space (and time and matter and energy) that happened everywhere in the universe. All matter and energy that exist today, including the particles of which you are made, came from the Big Bang. We were, and still are, in the midst of a Big Bang; it is all around us.
英語のヒント
初期宇宙モデルを巡るこの短い旅を、注意点で締めくくろう。ビッグバンを、巨大な星の爆発のような、空間の特定の場所で起こる爆発だと思ってはいけない。境界はなく、爆発が起きた一つの地点もなかった。空間そのもの、そして時間、物質、エネルギーの爆発が、宇宙のあらゆる場所で起きたのである。あなたを作る粒子も含め、現在存在する物質とエネルギーは、すべてビッグバンから来た。私たちはビッグバンの中にいたし、今もその中にいる。それは私たちの周りのあらゆる場所にある。