付録
Linear Regression線形回帰
Sample Data標本データ
The following data is real. The percent of declared ethnic minority students at De Anza College for selected years from 1970–1995 was:
英語のヒント
次のデータは実際のデータである。1970~1995年のうち選ばれた年について、デアンザ・カレッジで民族的少数派であると申告した学生の割合は、次のとおりだった。
Year 年 |
Student Ethnic Minority Percentage 民族的少数派の学生の割合(%) |
|---|---|
1970 |
14.13 |
1973 |
12.27 |
1976 |
14.08 |
1979 |
18.16 |
1982 |
27.64 |
1983 |
28.72 |
1986 |
31.86 |
1989 |
33.14 |
1992 |
45.37 |
1995 |
53.1 |
Student Ethnic Minority Percentage民族的少数派の学生の割合(%)
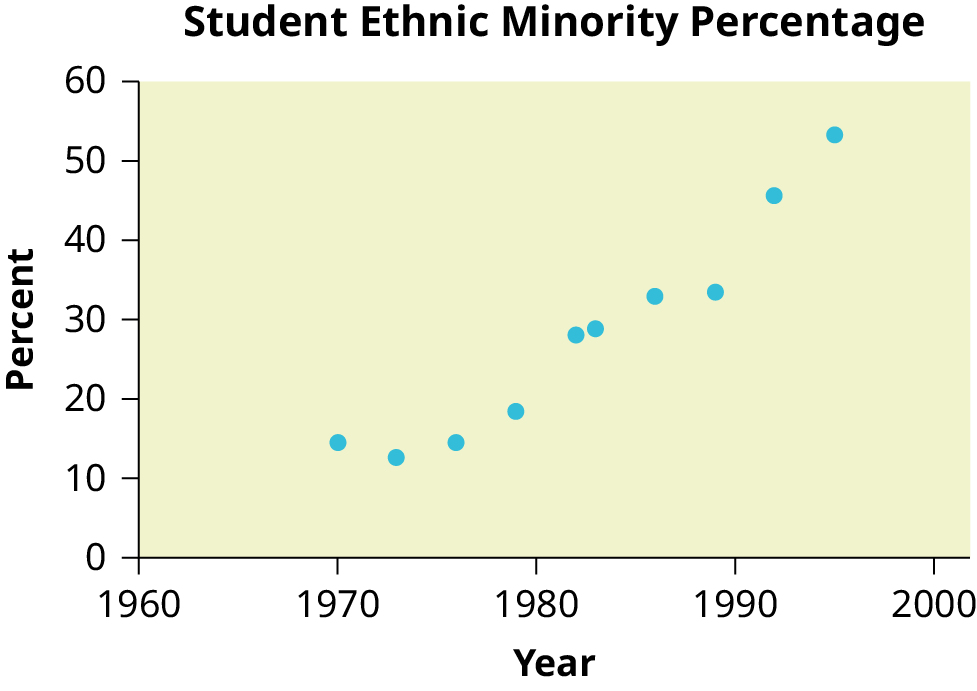
Figure G.1図 G.1
By hand, verify the scatterplot above.
手作業で上の散布図を確認せよ。
To enter data and do linear regression:データを入力し、線形回帰を行う
- Before accessing this program, be sure to turn off all plots.このプログラムを開く前に、必ずすべてのグラフを無効にする。
- Round to three decimal places. To do so:小数第3位に丸める。手順は次のとおり。
- Enter statistics mode and clear lists
[L1]and[L2], as describe previously.統計モードを開き、前述の方法でリスト[L1]と[L2]を消去する。, - Enter each value. Press各値を入力する。次のキーを押す。to continue.これで次へ進む。


To display the correlation coefficient:相関係数を表示する
- Arrow down and select
<DiagnosticOn>下向き矢印キーで移動し、<DiagnosticOn>を選択する。... ,, - and will be displayed during regression calculations.回帰計算の際に、とが表示される。

The display will show:
画面には次のように表示される。
LinRegLinReg
- y = a + bx
- a = –3176.909a = −3176.909
- b = 1.617
- r = 2 0.924
- r = 0.961
This means the Line of Best Fit (Least Squares Line) is:
これは、最適直線(最小二乗直線)が次のとおりであることを意味する。
- y = –3176.909 + 1.617xy = −3176.909 + 1.617x
- Percent = –3176.909 + 1.617 (year #)割合(%)= −3176.909 + 1.617 × 年の数値
The correlation coefficient r = 0.961
相関係数はr = 0.961である。
To see the scatter plot:散布図を表示する
- Navigate to the first picture.最初の図へ移動する。
- Navigate to
<Xlist>.<Xlist>へ移動する。 - If
[L1]is not selected, press[L1]が選択されていなければ、次のキーを押す。,[L1]to select it.続いて[L1]を押して選択する。 - Navigate to
<Ylist>.<Ylist>へ移動する。 - Use the arrows to turn off the remaining plots.矢印キーを使い、残りのグラフを無効にする。
- Access window mode to set the graph parameters.WINDOWモードを開き、グラフの設定値を入力する。
- (spacing of tick marks on x-axis)(x軸の目盛りの間隔)
- (spacing of tick marks on y-axis)(y軸の目盛りの間隔)
- Be sure to deselect or clear all equations before graphing, using the instructions above.グラフを描く前に、前述の手順で、必ずすべての式の選択を解除するか、式を消去する。
- Press the graph button to see the scatter plot.GRAPHキーを押し、散布図を表示する。


To see the regression graph:回帰直線のグラフを表示する
- Navigate to
<EQ>.<EQ>へ移動する。 - Press the graphing mode button. The regression line will be superimposed over the scatter plot.
英語のヒント
グラフ表示モードのキーを押す。回帰直線が散布図に重ねて表示される。


To see the residuals and use them to calculate the critical point for an outlier:残差を表示し、外れ値判定の臨界値を計算する
- Confirm twice to view the list of residuals. Use the arrows to select them.2回確定して残差のリストを表示する。矢印キーで各残差を選択する。,
- The critical point for an outlier is: where:外れ値判定の臨界値はである。各記号の意味は次のとおり。
- = number of pairs of data= データのペア数
- = sum of the squared errors= 誤差平方和
- Store the residuals in
[L3].残差を[L3]に保存する。,,[L3],、[L3]、 - Calculate the . Note thatを計算する。であることに注意する。,
[L3],、[L3]、,, - Store this value in
[L4].この値を[L4]に保存する。,,[L4],、[L4]、 - Calculate the critical value using the equation above.上の式を使って臨界値を計算する。,,,,,
[V],、[V]、,[LIST]、[LIST],,,,[L4],、[L4]、,, - Verify that the calculator displays: 7.642669563. This is the critical value.電卓に7.642669563と表示されることを確認する。これが臨界値である。
- Compare the absolute value of each residual value in
[L3]to 7.64. If the absolute value is greater than 7.64, then the (x, y) corresponding point is an outlier. In this case, none of the points is an outlier.英語のヒント
[L3]の各残差の絶対値を7.64と比較する。絶対値が7.64より大きければ、対応する点(x, y)は外れ値である。この例では、外れ値となる点はない。


To obtain estimates of y for various x-values:さまざまなxの値に対するyの推定値を求める
There are various ways to determine estimates for "y." One way is to substitute values for "x" in the equation. Another way is to use the
「y」の推定値を求める方法はいくつかある。1つは、式の「x」に値を代入する方法である。もう1つは、次のキーを使う方法である。


on the graph of the regression line.
回帰直線のグラフ上でこのキーを使う。