第6章正規分布
Introductionはじめに

credit: modification of work “Shoe shop” by Lo/ Flickr, Public Domain · Public domain (stated in original image credit) · Source出典
Figure 6.1図 6.1
If you ask enough people about their shoe size, you will find that your graphed data is shaped like a bell curve and can be described as normally distributed. (credit: modification of work “Shoe shop” by Lo/ Flickr, Public Domain)
十分に多くの人に靴のサイズを尋ねると、データのグラフは釣鐘形になり、正規分布に従うと表現できる。(出典:Lo/Flickrによる「Shoe shop」を改変、パブリックドメイン)
The normal, a continuous distribution, is the most important of all the distributions. It is widely used and even more widely abused. Its graph is bell-shaped. You see the bell curve in almost all disciplines. Some of these include psychology, business, economics, the sciences, nursing, and, of course, mathematics. Some of your instructors may use the normal distribution to help determine your grade. Most IQ scores are normally distributed. Often real-estate prices fit a normal distribution. The normal distribution is extremely important, but it cannot be applied to everything in the real world.
英語のヒント
連続分布である正規分布は、すべての分布の中で最も重要である。広く使われ、それ以上に広く誤用されている。グラフは釣鐘形である。釣鐘形の曲線は、ほぼあらゆる分野で見られる。心理学、ビジネス、経済学、自然科学、看護学、そしてもちろん数学もその一部である。教員が成績を決める際に正規分布を使うこともある。大部分のIQの得点は正規分布に従う。不動産価格も正規分布によく当てはまる。正規分布は極めて重要だが、現実世界のすべてに適用できるわけではない。
In this chapter, you will study the normal distribution, the standard normal distribution, and applications associated with them.
この章では、正規分布、標準正規分布、およびそれらに関連する応用を学ぶ。
The normal distribution has two parameters (two numerical descriptive measures): the mean (μ) and the standard deviation (σ). If X is a quantity to be measured that has a normal distribution with mean (μ) and standard deviation (σ), we designate this by writing
英語のヒント
正規分布には、平均(μ)と標準偏差(σ)という2つの母数(数値による2つの記述尺度)がある。Xが、平均μ、標準偏差σの正規分布に従う測定対象の量であるとき、次のように表す。
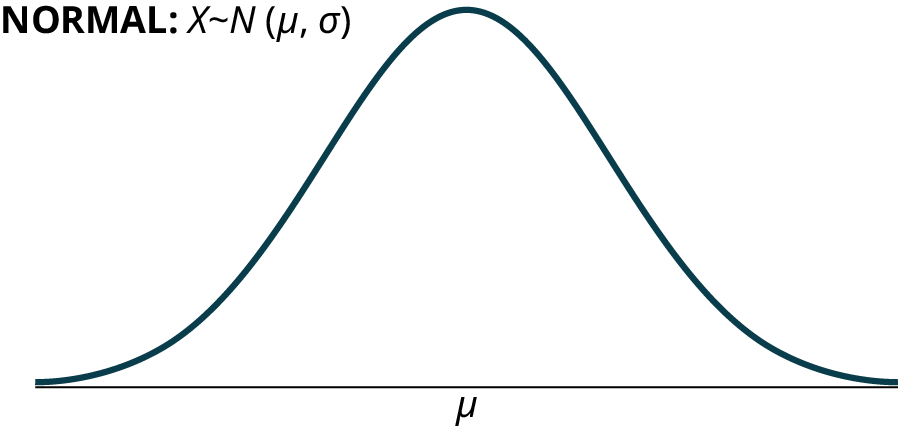

Figure 6.2図 6.2
The probability density function is a rather complicated mathematical function. Do not memorize it. It is not necessary.
確率密度関数は、かなり複雑な数学的関数である。暗記する必要はない。
f(x) =
The cumulative distribution function is P(X < x). It is calculated either by a calculator or a computer, or it is looked up in a table. Technology has made the tables virtually obsolete. For that reason, as well as the fact that there are various table formats, we are not including table instructions.
英語のヒント
累積分布関数はP(X < x)である。電卓やコンピューターで計算するか、表で調べる。計算機の普及で表はほぼ使われなくなった。この理由に加え、表の形式もさまざまなので、本書では表の使い方を取り上げない。
The curve is symmetric about a vertical line drawn through the mean, μ. In theory, the mean is the same as the median, because the graph is symmetric about μ. As the notation indicates, the normal distribution depends only on the mean and the standard deviation. Since the area under the curve must equal one, a change in the standard deviation, σ, causes a change in the shape of the curve; the curve becomes fatter or skinnier depending on σ. A change in μ causes the graph to shift to the left or right. This means there are an infinite number of normal probability distributions. One of special interest is called the standard normal distribution.
英語のヒント
曲線は平均μを通る垂直線に関して対称である。グラフがμに関して対称なので、理論上、平均と中央値は等しい。表記が示すように、正規分布は平均と標準偏差だけで決まる。曲線の下の面積は1でなければならないので、標準偏差σが変わると曲線の形が変わる。σによって曲線は横に広がったり細くなったりする。μが変わるとグラフは左右に移動する。つまり、正規確率分布は無限に存在する。その中でも特に関心を引くものを標準正規分布という。
Collaborative Exercise共同演習
Formula Review公式の復習
X ∼ N(μ, σ)
- μ = the meanμ = 平均
- σ = the standard deviationσ = 標準偏差
Normal Distribution
正規分布
a continuous random variable (RV) with pdf f(x) = , where μ is the mean of the distribution and σ is the standard deviation; notation: X ~ N(μ, σ). If μ = 0 and σ = 1, the RV is called the standard normal distribution.
確率密度関数がf(x) = である連続確率変数(RV)の分布。μは分布の平均、σは標準偏差である。X ~ N(μ, σ)と表す。μ = 0、σ = 1の場合を標準正規分布という。