第6章正規分布
References参考文献
“Naegele’s rule.” Wikipedia. Available online at http://en.wikipedia.org/wiki/Naegele's_rule (accessed May 14, 2013).
「ネーゲレの概算法」。Wikipedia。http://en.wikipedia.org/wiki/Naegele's_rule(2013年5月14日閲覧)。
“403: NUMMI.” Chicago Public Media & Ira Glass, 2013. Available online at http://www.thisamericanlife.org/radio-archives/episode/403/nummi (accessed May 14, 2013).
「403:NUMMI」。Chicago Public MediaおよびIra Glass、2013年。http://www.thisamericanlife.org/radio-archives/episode/403/nummi(2013年5月14日閲覧)。
“Scratch-Off Lottery Ticket Playing Tips.” WinAtTheLottery.com, 2013. Available online at http://www.winatthelottery.com/public/department40.cfm (accessed May 14, 2013).
「スクラッチ宝くじの遊び方のヒント」。WinAtTheLottery.com、2013年。http://www.winatthelottery.com/public/department40.cfm(2013年5月14日閲覧)。
“Smart Phone Users, By The Numbers.” Visual.ly, 2013. Available online at http://visual.ly/smart-phone-users-numbers (accessed May 14, 2013).
「数字で見るスマートフォン利用者」。Visual.ly、2013年。http://visual.ly/smart-phone-users-numbers(2013年5月14日閲覧)。
“Facebook Statistics.” Statistics Brain. Available online at http://www.statisticbrain.com/facebook-statistics/(accessed May 14, 2013).
「Facebookの統計」。Statistics Brain。http://www.statisticbrain.com/facebook-statistics/(2013年5月14日閲覧)。
Chapter Review章の復習
The normal distribution, which is continuous, is the most important of all the probability distributions. Its graph is bell-shaped. This bell-shaped curve is used in almost all disciplines. Since it is a continuous distribution, the total area under the curve is one. The parameters of the normal are the mean µ and the standard deviation σ. A special normal distribution, called the standard normal distribution is the distribution of z-scores. Its mean is zero, and its standard deviation is one.
連続分布である正規分布は、すべての確率分布の中で最も重要である。グラフは釣鐘形であり、この曲線はほぼあらゆる分野で使われる。連続分布なので、曲線の下の総面積は1である。正規分布の母数は平均μと標準偏差σである。標準正規分布という特別な正規分布はzスコアの分布であり、平均0、標準偏差1となる。
Formula Review公式の復習
Normal Distribution: X ~ N(µ, σ) where µ is the mean and σ is the standard deviation.
正規分布:X ~ N(μ, σ)。μは平均、σは標準偏差である。
Standard Normal Distribution: Z ~ N(0, 1).
標準正規分布:Z ~ N(0, 1)。
Calculator function for probability: normalcdf (lower x value of the area, upper x value of the area, mean, standard deviation)
確率を求める電卓の関数:normalcdf(面積を求めるxの下限、xの上限、平均、標準偏差)。
Calculator function for the kth percentile: k = invNorm (area to the left of k, mean, standard deviation)
第kパーセンタイルを求める電卓の関数:k = invNorm(kより左側の面積、平均、標準偏差)。
Exercises 51–57練習問題 51–57
Exercise 51問題 51
How would you represent the area to the left of one in a probability statement?
1より左側の面積を、確率の式でどう表すか。
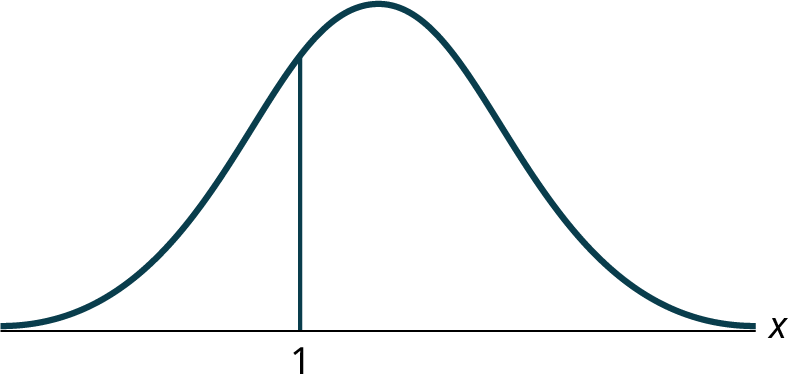
Figure 6.10図 6.10
Solution解き方
P(x < 1)
Exercise 52問題 52
Exercise 53問題 53
Is P(x < 1) equal to P(x ≤ 1)? Why?
P(x < 1)とP(x ≤ 1)は等しいか。なぜか。
Solution解き方
Yes, because they are the same in a continuous distribution: P(x = 1) = 0
等しい。連続分布ではP(x = 1) = 0なので、この二つは同じになる。
Exercise 54問題 54
Exercise 55問題 55
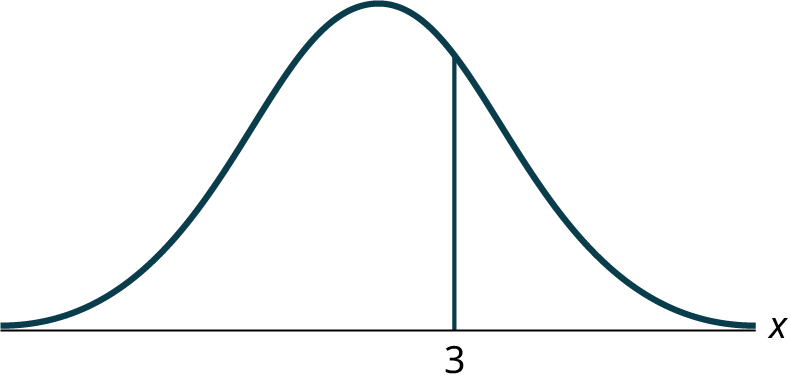
What is the area to the right of three?
3より右側の面積はいくらか。
Figure 6.13図 6.13
Solution解き方
1 – P(x < 3) or P(x > 3)
1 – P(x < 3)、またはP(x > 3)。
Exercise 56問題 56
If the area to the left of x in a normal distribution is 0.123, what is the area to the right of x?
正規分布でxより左側の面積が0.123であるとき、右側の面積はいくらか。
Exercise 57問題 57
If the area to the right of x in a normal distribution is 0.543, what is the area to the left of x?
正規分布でxより右側の面積が0.543であるとき、左側の面積はいくらか。
Solution解き方
1 – 0.543 = 0.457
Exercises 58–67練習問題 58–67
Use the following information to answer the next four exercises:
次の情報を使って、この後の4問に答えよ。
X ~ N(54, 8)
Exercise 58問題 58
Find the probability that x > 56.
x > 56となる確率を求めよ。
Exercise 59問題 59
Find the probability that x < 30.
x < 30となる確率を求めよ。
Solution解き方
0.0013
Exercise 60問題 60
Find the 80th percentile.
第80パーセンタイルを求めよ。
Exercise 61問題 61
Find the 60th percentile.
第60パーセンタイルを求めよ。
Solution解き方
56.03
Exercise 62問題 62
X ~ N(6, 2)
Find the probability that x is between three and nine.
xが3と9の間にある確率を求めよ。
Exercise 63問題 63
X ~ N(–3, 4)
Find the probability that x is between one and four.
xが1と4の間にある確率を求めよ。
Solution解き方
0.1186
Exercise 64問題 64
X ~ N(4, 5)
Find the maximum of x in the bottom quartile.
xの下位4分の1における最大値を求めよ。
Exercise 65問題 65
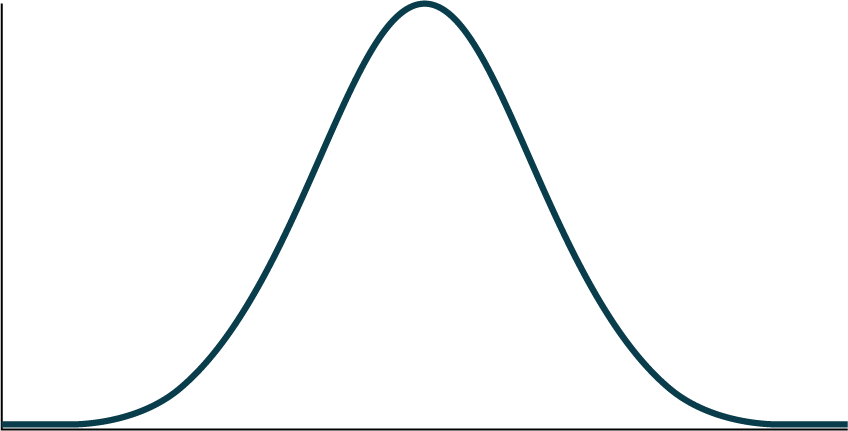
Use the following information to answer the next three exercise: The life of wearable fitness devices is normally distributed with a mean of 4.1 years and a standard deviation of 1.3 years. A wearable fitness device is guaranteed for three years. We are interested in the length of time a wearable fitness device lasts. Find the probability that a wearable fitness device will break down during the guarantee period.
英語のヒント
次の情報を使って、この後の3問に答えよ。ウェアラブル運動管理機器の寿命は、平均4.1年、標準偏差1.3年の正規分布に従う。この機器には3年間の保証がある。機器が使える期間に関心がある。保証期間中に故障する確率を求めよ。
- Sketch the situation. Label and scale the axes. Shade the region corresponding to the probability.状況を図示せよ。軸にラベルと目盛りを付け、確率に対応する部分を塗れ。Figure 6.14図 6.14
- P(0 < x < ____________) = ___________ (Use zero for the minimum value of x.)P(0 < x < ____________) = ___________(xの最小値には0を使う。)
Solution解き方
- Answers may vary.解答は一通りではない。
- 3, 0.1979
Exercise 66問題 66
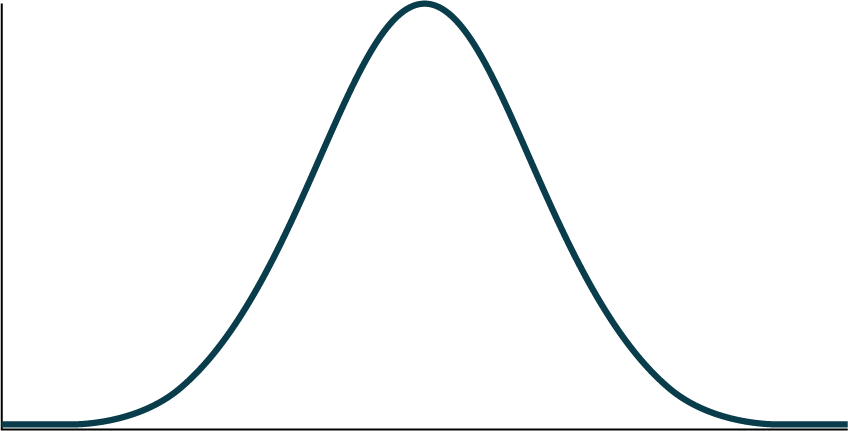
Find the probability that a wearable fitness device will last between 2.8 and six years.
ウェアラブル運動管理機器の寿命が2.8〜6年となる確率を求めよ。
- Sketch the situation. Label and scale the axes. Shade the region corresponding to the probability.状況を図示せよ。軸にラベルと目盛りを付け、確率に対応する部分を塗れ。Figure 6.15図 6.15
- P(__________ < x < __________) = __________


Exercise 67問題 67
Find the 70th percentile of the distribution for the time a wearable fitness device lasts.
ウェアラブル運動管理機器の寿命の分布の第70パーセンタイルを求めよ。
- Sketch the situation. Label and scale the axes. Shade the region corresponding to the lower 70%.状況を図示せよ。軸にラベルと目盛りを付け、下位70%に対応する部分を塗れ。Figure 6.16図 6.16
- P(x < k) = __________ Therefore, k = _________P(x < k) = __________。したがってk = _________。
Solution解き方
- Answers may vary.解答は一通りではない。
- 0.70, 4.78 years0.70、4.78年。
Homework宿題
Exercises 68–69練習問題 68–69
Use the following information to answer the next two exercises: The patient recovery time from a particular surgical procedure is normally distributed with a mean of 5.3 days and a standard deviation of 2.1 days.
次の情報を使って、この後の2問に答えよ。ある手術から患者が回復するまでの時間は、平均5.3日、標準偏差2.1日の正規分布に従う。
Exercise 68問題 68
What is the probability of spending more than two days in recovery?
回復に2日を超える時間がかかる確率はいくらか。
- 0.0580
- 0.8447
- 0.0553
- 0.9420
Exercise 69問題 69
The 90th percentile for recovery times is?
回復時間の第90パーセンタイルはいくつか。
- 8.89
- 7.07
- 7.99
- 4.32
Solution解き方
c
Exercises 70–88練習問題 70–88
Use the following information to answer the next three exercises: The length of time it takes to find a parking space at 9 A.M. follows a normal distribution with a mean of five minutes and a standard deviation of two minutes.
次の情報を使って、この後の3問に答えよ。午前9時に駐車場所を見つけるまでの時間は、平均5分、標準偏差2分の正規分布に従う。
Exercise 70問題 70
Based upon the given information and numerically justified, would you be surprised if it took less than one minute to find a parking space?
駐車場所が1分未満で見つかったら驚くか。与えられた情報に基づき、数値で根拠を示せ。
- Yesはい。
- Noいいえ
- Unable to determine判断できない。
Exercise 71問題 71
Find the probability that it takes at least eight minutes to find a parking space.
駐車場所を見つけるのに少なくとも8分かかる確率を求めよ。
- 0.0001
- 0.9270
- 0.1862
- 0.0668
Solution解き方
d
Exercise 72問題 72
Seventy percent of the time, it takes more than how many minutes to find a parking space?
駐車場所を見つけるのに、70%の場合は何分を超える時間がかかるか。
- 1.24
- 2.41
- 3.95
- 6.05
Exercise 73問題 73
According to a study done by De Anza students, the height for Asian adult males is normally distributed with an average of 66 inches and a standard deviation of 2.5 inches. Suppose one Asian adult male is randomly chosen. Let X = height of the individual.
デアンザの学生による研究では、アジア系成人男性の身長は平均66インチ、標準偏差2.5インチの正規分布に従う。アジア系成人男性を1人無作為に選ぶとする。X = その人の身長とする。
- X ~ _____(_____,_____)
- Find the probability that the person is between 65 and 69 inches. Include a sketch of the graph, and write a probability statement.その人の身長が65〜69インチである確率を求めよ。グラフの概形を描き、確率の式を書け。
- Would you expect to meet many Asian adult males over 72 inches? Explain why or why not, and justify your answer numerically.身長72インチを超えるアジア系成人男性に多く出会うと思うか。理由を説明し、数値で根拠を示せ。
Solution解き方
- X ~ N(66, 2.5)
- 0.5404
- No, the probability that an Asian male is over 72 inches tall is 0.0082いいえ。アジア系男性の身長が72インチを超える確率は0.0082である。
Exercise 74問題 74
IQ is normally distributed with a mean of 100 and a standard deviation of 15. Suppose one individual is randomly chosen. Let X = IQ of an individual.
IQは平均100、標準偏差15の正規分布に従う。1人を無作為に選ぶとする。X = その人のIQとする。
- X ~ _____(_____,_____)
- Find the probability that the person has an IQ greater than 120. Include a sketch of the graph, and write a probability statement.その人のIQが120を超える確率を求めよ。グラフの概形を描き、確率の式を書け。
- MENSA is an organization whose members have the top 2% of all IQs. Find the minimum IQ needed to qualify for the MENSA organization. Sketch the graph, and write the probability statement.
英語のヒント
MENSAは、IQが全体の上位2%に入る人を会員とする団体である。MENSAに入会する資格を得るために必要な最小のIQを求めよ。グラフの概形を描き、確率の式を書け。 - The middle 50% of IQs fall between what two values? Sketch the graph and write the probability statement.IQの中央50%は、どの2つの値の間に入るか。グラフの概形を描き、確率の式を書け。
Exercise 75問題 75
The percent of fat calories that a person in America consumes each day is normally distributed with a mean of about 36 and a standard deviation of 10. Suppose that one individual is randomly chosen. Let X = percent of fat calories.
英語のヒント
米国の人が1日に摂取するカロリーのうち、脂肪から得る割合(%)は、平均約36、標準偏差10の正規分布に従う。1人を無作為に選ぶとする。X = 脂肪由来のカロリーの百分率とする。
- X ~ _____(_____,_____)
- Find the probability that the percent of fat calories a person consumes is more than 40. Graph the situation. Shade in the area to be determined.摂取カロリーのうち脂肪由来の百分率が40を超える確率を求めよ。状況をグラフにし、求める面積の部分を塗れ。
- Find the maximum number for the lower quarter of percent of fat calories. Sketch the graph and write the probability statement.脂肪由来のカロリーの百分率の下位4分の1における最大値を求めよ。グラフの概形を描き、確率の式を書け。
Solution解き方
- X ~ N(36, 10)
- The probability that a person consumes more than 40% of their calories as fat is 0.3446.摂取カロリーの40%を超える分を脂肪から得る確率は、0.3446である。
- Approximately 25% of people consume less than 29.26% of their calories as fat.約25%の人は、摂取カロリーの29.26%未満を脂肪から得ている。
Exercise 76問題 76
Suppose that the distance of fly balls hit to the outfield (in baseball) is normally distributed with a mean of 250 feet and a standard deviation of 50 feet.
野球で外野に打ち上げたフライの飛距離が、平均250フィート、標準偏差50フィートの正規分布に従うとする。
- If X = distance in feet for a fly ball, then X ~ _____(_____,_____)X = フライの飛距離(フィート)とすると、X ~ _____(_____,_____)。
- If one fly ball is randomly chosen from this distribution, what is the probability that this ball traveled fewer than 220 feet? Sketch the graph. Scale the horizontal axis X. Shade the region corresponding to the probability. Find the probability.この分布からフライを1球無作為に選んだとき、飛距離が220フィート未満である確率はいくらか。グラフの概形を描き、横軸Xに目盛りを付け、確率に対応する部分を塗れ。確率を求めよ。
- Find the 80th percentile of the distribution of fly balls. Sketch the graph, and write the probability statement.フライの飛距離の分布の第80パーセンタイルを求めよ。グラフの概形を描き、確率の式を書け。
Exercise 77問題 77
In China, four-year-olds average three hours a day unsupervised. Most of the unsupervised children live in rural areas, considered safe. Suppose that the standard deviation is 1.5 hours and the amount of time spent alone is normally distributed. We randomly select one Chinese four-year-old living in a rural area. We are interested in the amount of time the child spends alone per day.
英語のヒント
中国の4歳児は、1日に平均3時間、大人の見守りなしで過ごす。こうした子どもの大半は、安全と考えられている農村部に住んでいる。1人で過ごす時間は標準偏差1.5時間の正規分布に従うとする。農村部に住む中国の4歳児を1人無作為に選ぶ。その子が1日に1人で過ごす時間に関心がある。
- In words, define the random variable X.確率変数Xを言葉で定義せよ。
- X ~ _____(_____,_____)
- Find the probability that the child spends less than one hour per day unsupervised. Sketch the graph, and write the probability statement.その子が見守りなしで過ごす時間が1日1時間未満である確率を求めよ。グラフの概形を描き、確率の式を書け。
- What percent of the children spend over ten hours per day unsupervised?子どもの何%が、1日に10時間を超えて見守りなしで過ごすか。
- Seventy percent of the children spend at least how long per day unsupervised?子どもの70%は、1日に少なくともどれほどの時間を見守りなしで過ごすか。
Solution解き方
- X = number of hours that a Chinese four-year-old in a rural area is unsupervised during the day.X = 農村部に住む中国の4歳児が、1日のうち見守りなしで過ごす時間数。
- X ~ N(3, 1.5)
- The probability that the child spends less than one hour a day unsupervised is 0.0918.その子が見守りなしで過ごす時間が1日1時間未満である確率は、0.0918である。
- The probability that a child spends over ten hours a day unsupervised is less than 0.0001.子どもが1日に10時間を超えて見守りなしで過ごす確率は、0.0001未満である。
- 2.21 hours2.21時間。
Exercise 78問題 78
In a certain presidential election, Alaska’s 40 election districts averaged 1,956.8 votes per district for Candidate A. The standard deviation was 572.3. (There are only 40 election districts in Alaska.) The distribution of the votes per district for Candidate A was bell-shaped. Let X = number of votes for Candidate A for an election district.
英語のヒント
ある大統領選挙で、アラスカ州の40選挙区における候補者Aの得票数は、1選挙区当たり平均1,956.8票、標準偏差572.3票だった。(アラスカ州の選挙区は40しかない。)候補者Aの選挙区別得票数の分布は釣鐘形だった。X = ある選挙区における候補者Aの得票数とする。
- State the approximate distribution of X.Xがほぼ従う分布を示せ。
- Is 1,956.8 a population mean or a sample mean? How do you know?1,956.8は母平均か、標本平均か。どうしてわかるか。
- Find the probability that a randomly selected district had fewer than 1,600 votes for Candidate A. Sketch the graph and write the probability statement.無作為に選んだ選挙区で、候補者Aの得票数が1,600票未満だった確率を求めよ。グラフの概形を描き、確率の式を書け。
- Find the probability that a randomly selected district had between 1,800 and 2,000 votes for Candidate A.無作為に選んだ選挙区で、候補者Aの得票数が1,800〜2,000票だった確率を求めよ。
- Find the third quartile for votes for Candidate A.候補者Aの得票数の第3四分位数を求めよ。
Exercise 79問題 79
Suppose that the duration of a particular type of criminal trial is known to be normally distributed with a mean of 21 days and a standard deviation of seven days.
英語のヒント
ある種類の刑事裁判にかかる日数は、平均21日、標準偏差7日の正規分布に従うことがわかっているとする。
- In words, define the random variable X.確率変数Xを言葉で定義せよ。
- X ~ _____(_____,_____)
- If one of the trials is randomly chosen, find the probability that it lasted at least 24 days. Sketch the graph and write the probability statement.この裁判を1件無作為に選んだとき、少なくとも24日間かかった確率を求めよ。グラフの概形を描き、確率の式を書け。
- Sixty percent of all trials of this type are completed within how many days?この種類の裁判の60%は、何日以内に終了するか。
Solution解き方
- X = the distribution of the number of days a particular type of criminal trial will takeX = ある種類の刑事裁判にかかる日数の分布。
- X ~ N(21, 7)
- The probability that a randomly selected trial will last more than 24 days is 0.3336.無作為に選んだ裁判が24日を超えて続く確率は、0.3336である。
- 22.77
Exercise 80問題 80
A motorcycle racer averages 129.71 seconds per 2.5 mile lap (in a seven-lap race) with a standard deviation of 2.28 seconds. The distribution of their race times is normally distributed. We are interested in one of their randomly selected laps.
あるオートバイ選手の、2.5マイルのコース1周のタイムは、平均129.71秒、標準偏差2.28秒である(レースは7周で行う)。この選手のタイムは正規分布に従う。無作為に選んだ1周に関心がある。
- In words, define the random variable X.確率変数Xを言葉で定義せよ。
- X ~ _____(_____,_____)
- Find the percent of the racer's laps that are completed in less than 130 seconds.この選手が130秒未満で走り終える周回の百分率を求めよ。
- The fastest 3% of the racer's laps are under _____.この選手の速いほうから3%の周回タイムは、_____未満である。
- The middle 80% of the racer's laps are from _______ seconds to _______ seconds.この選手の周回タイムの中央80%は、_______秒から_______秒の範囲である。
Exercise 81問題 81
Thuy Dau, Ngoc Bui, Sam Su, and Lan Voung conducted a survey as to how long customers at Lucky claimed to wait in the checkout line until their turn. Let X = time in line. Table 6.1 displays the ordered real data (in minutes):
英語のヒント
Thuy Dau、Ngoc Bui、Sam Su、Lan Voungは、Luckyの客がレジの列で自分の番までどれほど待ったと答えるかを調査した。X = 列での待ち時間とする。表6.1は、実際のデータを順に並べたものである(単位:分)。
0.50 |
4.25 |
5 |
6 |
7.25 |
1.75 |
4.25 |
5.25 |
6 |
7.25 |
2 |
4.25 |
5.25 |
6.25 |
7.25 |
2.25 |
4.25 |
5.5 |
6.25 |
7.75 |
2.25 |
4.5 |
5.5 |
6.5 |
8 |
2.5 |
4.75 |
5.5 |
6.5 |
8.25 |
2.75 |
4.75 |
5.75 |
6.5 |
9.5 |
3.25 |
4.75 |
5.75 |
6.75 |
9.5 |
3.75 |
5 |
6 |
6.75 |
9.75 |
3.75 |
5 |
6 |
6.75 |
10.75 |
- Calculate the sample mean and the sample standard deviation.標本平均と標本標準偏差を計算せよ。
- Construct a histogram.ヒストグラムを作れ。
- Draw a smooth curve through the midpoints of the tops of the bars.各棒の上端の中央を通る滑らかな曲線を描け。
- In words, describe the shape of your histogram and smooth curve.ヒストグラムと滑らかな曲線の形を言葉で説明せよ。
- Let the sample mean approximate μ and the sample standard deviation approximate σ. The distribution of X can then be approximated by X ~ _____(_____,_____)標本平均をμの近似値、標本標準偏差をσの近似値とする。このとき、Xの分布はX ~ _____(_____,_____)で近似できる。
- Use the distribution in part e to calculate the probability that a person will wait fewer than 6.1 minutes.eの分布を使い、ある人の待ち時間が6.1分未満となる確率を計算せよ。
- Determine the cumulative relative frequency for waiting less than 6.1 minutes.待ち時間が6.1分未満である累積相対度数を求めよ。
- Why aren’t the answers to part f and part g exactly the same?fとgの答えが完全に同じではないのはなぜか。
- Why are the answers to part f and part g as close as they are?
英語のヒント
fとgの答えがこれほど近いのはなぜか。 - If only ten customers has been surveyed rather than 50, do you think the answers to part f and part g would have been closer together or farther apart? Explain your conclusion.調査した客が50人ではなく10人だけだったら、fとgの答えはもっと近くなると思うか、それとも離れると思うか。結論を説明せよ。
Solution解き方
- mean = 5.51, s = 2.15平均 = 5.51、s = 2.15。
- Answers may vary.解答は一通りではない。
- Answers may vary.解答は一通りではない。
- Answers may vary.解答は一通りではない。
- X ~ N(5.51, 2.15)
- 0.6029
- The cumulative frequency for less than 6.1 minutes is 0.64.6.1分未満の累積度数は0.64である。
- The answers to part f and part g are not exactly the same, because the normal distribution is only an approximation to the real one.正規分布は実際の分布の近似にすぎないので、fとgの答えは完全には一致しない。
- The answers to part f and part g are close, because a normal distribution is an excellent approximation when the sample size is greater than 30.標本サイズが30より大きいとき、正規分布は非常によい近似になるので、fとgの答えは近い。
- The approximation would have been less accurate, because the smaller sample size means that the data does not fit normal curve as well.標本サイズが小さくなると、データが正規曲線にあまりよく当てはまらなくなるため、近似の精度は低くなっただろう。
Exercise 82問題 82
Suppose that Ric and Anita attend different colleges. Ric’s GPA is the same as the average GPA at their school. Anita’s GPA is 0.70 standard deviations above her school average. In complete sentences, explain why each of the following statements may be false.
リックとアニタは異なる大学に通っているとする。リックのGPAは自分の大学の平均GPAと同じであり、アニタのGPAは自分の大学の平均より標準偏差0.70個分だけ高い。次の各記述が誤りでありうる理由を、完全な文で説明せよ。
- Ric’s actual GPA is lower than Anita’s actual GPA.リックの実際のGPAは、アニタの実際のGPAより低い。
- Ric is not passing because their z-score is zero.リックのzスコアは0なので、合格点に達していない。
- Anita is in the 70th percentile of students at her college.アニタは自分の大学の学生の第70パーセンタイルにいる。
Exercise 83問題 83
Table 6.2 shows a sample of the maximum capacity (maximum number of spectators) of sports stadiums. The table does not include horse-racing or motor-racing stadiums.
英語のヒント
表6.2は、スポーツ競技場の最大収容人数(観客数の上限)の標本を示す。競馬場とモータースポーツの競技場は含まれていない。
40,000 |
40,000 |
45,050 |
45,500 |
46,249 |
48,134 |
49,133 |
50,071 |
50,096 |
50,466 |
50,832 |
51,100 |
51,500 |
51,900 |
52,000 |
52,132 |
52,200 |
52,530 |
52,692 |
53,864 |
54,000 |
55,000 |
55,000 |
55,000 |
55,000 |
55,000 |
55,000 |
55,082 |
57,000 |
58,008 |
59,680 |
60,000 |
60,000 |
60,492 |
60,580 |
62,380 |
62,872 |
64,035 |
65,000 |
65,050 |
65,647 |
66,000 |
66,161 |
67,428 |
68,349 |
68,976 |
69,372 |
70,107 |
70,585 |
71,594 |
72,000 |
72,922 |
73,379 |
74,500 |
75,025 |
76,212 |
78,000 |
80,000 |
80,000 |
82,300 |
- Calculate the sample mean and the sample standard deviation for the maximum capacity of sports stadiums (the data).スポーツ競技場の最大収容人数(データ)の標本平均と標本標準偏差を計算せよ。
- Construct a histogram.ヒストグラムを作れ。
- Draw a smooth curve through the midpoints of the tops of the bars of the histogram.ヒストグラムの各棒の上端の中央を通る滑らかな曲線を描け。
- In words, describe the shape of your histogram and smooth curve.ヒストグラムと滑らかな曲線の形を言葉で説明せよ。
- Let the sample mean approximate μ and the sample standard deviation approximate σ. The distribution of X can then be approximated by X ~ _____(_____,_____).標本平均をμの近似値、標本標準偏差をσの近似値とする。このとき、Xの分布はX ~ _____(_____,_____)で近似できる。
- Use the distribution in part e to calculate the probability that the maximum capacity of sports stadiums is less than 67,000 spectators.eの分布を使い、スポーツ競技場の最大収容人数が67,000人未満となる確率を計算せよ。
- Determine the cumulative relative frequency that the maximum capacity of sports stadiums is less than 67,000 spectators. Hint: Order the data and count the sports stadiums that have a maximum capacity less than 67,000. Divide by the total number of sports stadiums in the sample.スポーツ競技場の最大収容人数が67,000人未満である累積相対度数を求めよ。ヒント:データを順に並べ、最大収容人数が67,000人未満の競技場を数える。その数を標本中の競技場の総数で割る。
- Why aren’t the answers to part f and part g exactly the same?fとgの答えが完全に同じではないのはなぜか。
Solution解き方
- mean = 60,136
s = 10,468平均 = 60,136、s = 10,468。 - Answers will vary.答えはさまざまである。
- Answers will vary.答えはさまざまである。
- Answers will vary.答えはさまざまである。
- X ~ N(60136, 10468)
- 0.7440
- The cumulative relative frequency is 43/60 = 0.717.累積相対度数は43/60 = 0.717である。
- The answers for part f and part g are not the same, because the normal distribution is only an approximation.正規分布は近似にすぎないので、fとgの答えは同じではない。
Exercise 84問題 84
An expert witness for a paternity lawsuit testifies that the length of a pregnancy is normally distributed with a mean of 280 days and a standard deviation of 13 days. The person who is being sued for lack of child support was out of the country from 240 to 306 days before the birth of the child, so the pregnancy would have been less than 240 days or more than 306 days long if he was the biological parent. The birth was uncomplicated, and the child needed no medical intervention. What is the probability that he was NOT the parent? What is the probability that he could be the parent? Calculate the z-scores first, and then use those to calculate the probability.
英語のヒント
父子関係を争う訴訟で、専門家証人が、妊娠期間は平均280日、標準偏差13日の正規分布に従うと証言した。養育費を払わなかったとして訴えられている男性は、子どもが生まれる306日前から240日前まで国外にいた。したがって、その男性が生物学的な親なら、妊娠期間は240日未満、または306日を超えていたことになる。出産に合併症はなく、子どもにも医療的な処置は必要なかった。その男性が親ではなかった確率はいくらか。親でありえた確率はいくらか。まずzスコアを計算し、それを使って確率を計算せよ。
Exercise 85問題 85
An automotive factory can build an average of 6,000 cars and trucks a week. Generally, 10% of the cars were defective coming off the assembly line. Suppose we draw a random sample of n = 100 cars. Let X represent the number of defective cars in the sample. What can we say about X in regard to the 68-95-99.7 empirical rule (one standard deviation, two standard deviations and three standard deviations from the mean are being referred to)? Assume a normal distribution for the defective cars in the sample.
英語のヒント
ある自動車工場は、乗用車とトラックを週平均6,000台生産できる。一般に、組立ラインから出てくる車の10%には欠陥があった。n = 100台の無作為標本を取るとする。Xを標本中の欠陥車の台数とする。68-95-99.7の経験則に照らし、Xについて何がいえるか。ここでいう経験則は、平均から標準偏差1つ分、2つ分、3つ分の範囲を指す。標本中の欠陥車の台数に正規分布を仮定せよ。
Solution解き方
- n = 100; p = 0.1; q = 0.9
- μ = np = (100)(0.10) = 10
- σ = = = 3
- z = ±1: x1 = µ + zσ = 10 + 1(3) = 13 and x2 = µ – zσ = 10 – 1(3) = 7. 68% of the defective cars will fall between seven and 13.z = ±1:x1 = μ + zσ = 10 + 1(3) = 13、x2 = μ – zσ = 10 – 1(3) = 7。欠陥車の台数は68%の場合、7〜13台に入る。
- z = ±2: x1 = µ + zσ = 10 + 2(3) = 16 and x2 = µ – zσ = 10 – 2(3) = 4. 95 % of the defective cars will fall between four and 16z = ±2:x1 = μ + zσ = 10 + 2(3) = 16、x2 = μ – zσ = 10 – 2(3) = 4。欠陥車の台数は95%の場合、4〜16台に入る。
- z = ±3: x1 = µ + zσ = 10 + 3(3) = 19 and x2 = µ – zσ = 10 – 3(3) = 1. 99.7% of the defective cars will fall between one and 19.z = ±3:x1 = μ + zσ = 10 + 3(3) = 19、x2 = μ – zσ = 10 – 3(3) = 1。欠陥車の台数は99.7%の場合、1〜19台に入る。
Exercise 86問題 86
We flip a coin 100 times (n = 100) and note that it only comes up heads 20% (p = 0.20) of the time. The mean and standard deviation for the number of times the coin lands on heads is µ = 20 and σ = 4 (verify the mean and standard deviation). Solve the following:
コインを100回投げる(n = 100)と、表が出るのは全体の20%(p = 0.20)だけだった。表が出る回数の平均と標準偏差はμ = 20、σ = 4である(平均と標準偏差を確かめよ)。次の問いに答えよ。
- There is about a 68% chance that the number of heads will be somewhere between ___ and ___.表が出る回数が___と___の間になる確率は、約68%である。
- There is about a ____chance that the number of heads will be somewhere between 12 and 28.表が出る回数が12と28の間になる確率は、約____である。
- There is about a ____ chance that the number of heads will be somewhere between eight and 32.表が出る回数が8と32の間になる確率は、約____である。
Exercise 87問題 87
A $1 scratch off lotto ticket will be a winner one out of five times. Out of a shipment of n = 190 lotto tickets, find the probability for the lotto tickets that there are
英語のヒント
1ドルのスクラッチ宝くじは、5枚に1枚の割合で当たる。n = 190枚の入荷分について、当たりの枚数が次の範囲になる確率を求めよ。
- somewhere between 34 and 54 prizes.34枚と54枚の間。
- somewhere between 54 and 64 prizes.54枚と64枚の間。
- more than 64 prizes.64枚を超える。
Solution解き方
- n = 190; p = = 0.2; q = 0.8
- μ = np = (190)(0.2) = 38
- σ = = = 5.5136
- For this problem: P(34 < x < 54) = normalcdf(34,54,48,5.5136) = 0.7641この問題では、P(34 < x < 54) = normalcdf(34,54,48,5.5136) = 0.7641となる。
- For this problem: P(54 < x < 64) = normalcdf(54,64,48,5.5136) = 0.0018この問題では、P(54 < x < 64) = normalcdf(54,64,48,5.5136) = 0.0018となる。
- For this problem: P(x > 64) = normalcdf(64,1099,48,5.5136) = 0.0000012 (approximately 0)この問題では、P(x > 64) = normalcdf(64,1099,48,5.5136) = 0.0000012(ほぼ0)となる。
Exercise 88問題 88
On average, 28% of 18 to 34 year olds check social media before getting out of bed in the morning. Suppose this percentage follows a normal distribution with a standard deviation of 5%.
18〜34歳の人の平均28%は、朝ベッドを出る前にソーシャルメディアを確認する。この百分率は、標準偏差5%の正規分布に従うとする。
- Find the probability that the percent of 18 to 34-year-olds who check social media before getting out of bed in the morning is at least 30.朝ベッドを出る前にソーシャルメディアを確認する18〜34歳の人の百分率が、30以上となる確率を求めよ。
- Find the 95th percentile, and express it in a sentence.第95パーセンタイルを求め、その意味を文で表せ。