第6章正規分布
6.2 Using the Normal Distribution6.2 正規分布の利用
The shaded area in the following graph indicates the area to the left of x. This area is represented by the probability P(X < x). Normal tables, computers, and calculators provide or calculate the probability P(X < x).
次のグラフで塗られた部分は、xより左側の面積を示す。この面積は確率P(X < x)で表される。正規分布表、コンピューター、電卓から確率P(X < x)を求められる。
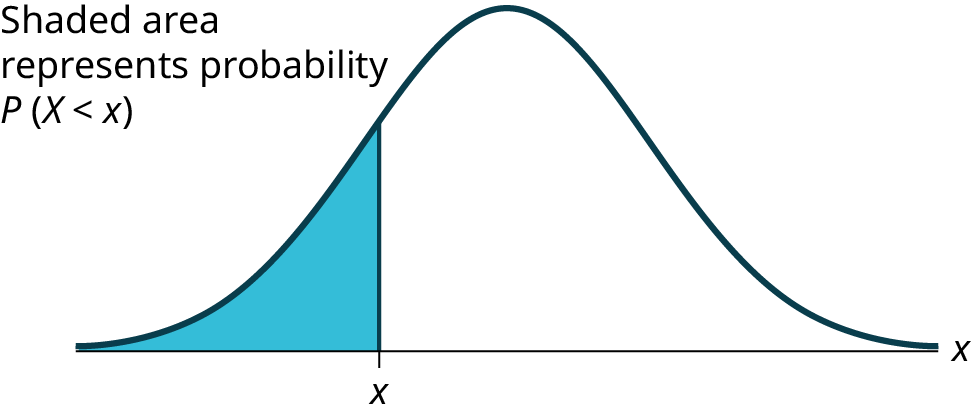
Figure 6.4図 6.4
The area to the right is then P ( X > x ) = 1 – P ( X < x ). Remember, P ( X < x ) = Area to the left of the vertical line through x . P ( X > x ) = 1 – P ( X < x ) = Area to the right of the vertical line through x . P ( X < x ) is the same as P ( X ≤ x ) and P ( X > x ) is the same as P ( X ≥ x ) for continuous distributions.
右側の面積はP(X > x) = 1 – P(X < x)である。P(X < x)は、xを通る垂直線より左側の面積であることを思い出そう。P(X > x) = 1 – P(X < x)は、その垂直線より右側の面積となる。連続分布では、P(X < x)とP(X ≤ x)は等しく、P(X > x)とP(X ≥ x)も等しい。
Calculations of Probabilities確率の計算
Probabilities are calculated using technology. There are instructions given as necessary for the TI-83+ and TI-84 calculators.
確率の計算には計算機を使う。必要に応じて、TI-83+とTI-84の操作方法を示す。
Example 6.7例題 6.7
If the area to the left is 0.0228, then the area to the right is 1 – 0.0228 = 0.9772.
左側の面積が0.0228なら、右側の面積は1 – 0.0228 = 0.9772となる。
Example 6.8例題 6.8
The final exam scores in a statistics class were normally distributed with a mean of 63 and a standard deviation of five.
ある統計学のクラスの期末試験の得点は、平均63、標準偏差5の正規分布に従っていた。
a. Find the probability that a randomly selected student scored more than 65 on the exam.
a. 無作為に選んだ学生の試験得点が65を超える確率を求めよ。
Solution解き方
a. Let X = a score on the final exam. X ~ N(63, 5), where μ = 63 and σ = 5.
a. X = 期末試験の得点とする。μ = 63、σ = 5なので、X ~ N(63, 5)である。
Draw a graph.
グラフを描く。
Then, find P(x > 65).
次にP(x > 65)を求める。
P(x > 65) = 0.3446
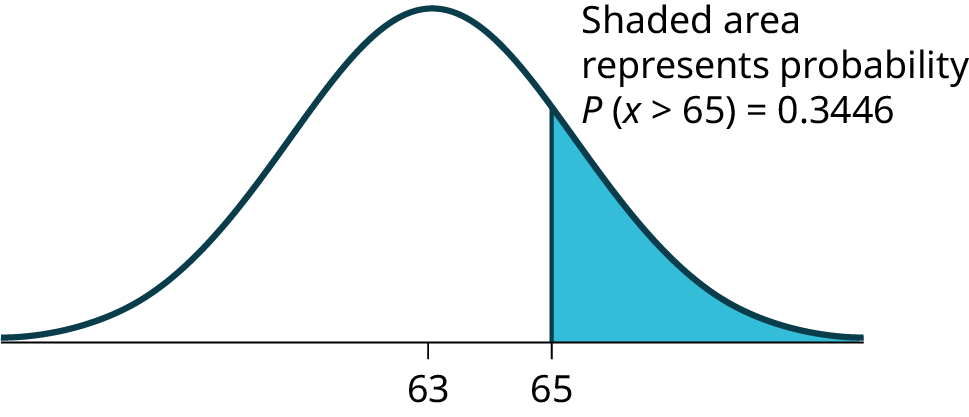
Figure 6.5図 6.5
The probability that any student selected at random scores more than 65 is 0.3446.
無作為に選んだ学生の得点が65を超える確率は0.3446である。
Using the Calculator電卓の操作
z = = 0.4
Area to the left is 0.6554.
左側の面積は0.6554である。
P(x > 65) = P(z > 0.4) = 1 – 0.6554 = 0.3446
Using the Calculator電卓の操作
b. Find the probability that a randomly selected student scored less than 85.
b. 無作為に選んだ学生の得点が85未満である確率を求めよ。
Solution解き方
b. Draw a graph.
b. グラフを描く。
Then find P(x < 85), and shade the graph.
次にP(x < 85)を求め、グラフの対応する部分を塗る。
Using a computer or calculator, find P(x < 85) = 1.
コンピューターまたは電卓を使うと、P(x < 85) = 1となる。
normalcdf(0,85,63,5) = 1 (rounds to one)
normalcdf(0,85,63,5) = 1(丸めると1になる)。
The probability that one student scores less than 85 is approximately one (or 100%).
学生1人の得点が85未満となる確率は、ほぼ1(100%)である。
c. Find the 90th percentile (that is, find the score k that has 90% of the scores below k and 10% of the scores above k).
c. 第90パーセンタイルを求めよ。すなわち、得点の90%がkより低く、10%がkより高くなる得点kを求めよ。
Solution解き方
c. Find the 90th percentile. For each problem or part of a problem, draw a new graph. Draw the x-axis. Shade the area that corresponds to the 90th percentile.
c. 第90パーセンタイルを求める。問題や小問ごとに、新しいグラフを描く。x軸を描き、第90パーセンタイルに対応する部分を塗る。
Let k = the 90th percentile. The variable k is located on the x-axis. P(x < k) is the area to the left of k. The 90th percentile k separates the exam scores into those that are the same or lower than k and those that are the same or higher. Ninety percent of the test scores are the same or lower than k, and ten percent are the same or higher. The variable k is often called a critical value.
英語のヒント
k = 第90パーセンタイルとする。変数kはx軸上にある。P(x < k)はkより左側の面積である。第90パーセンタイルkは、試験得点をk以下とk以上に分ける。得点の90%がk以下、10%がk以上となる。変数kは臨界値ともよく呼ばれる。
k = 69.4
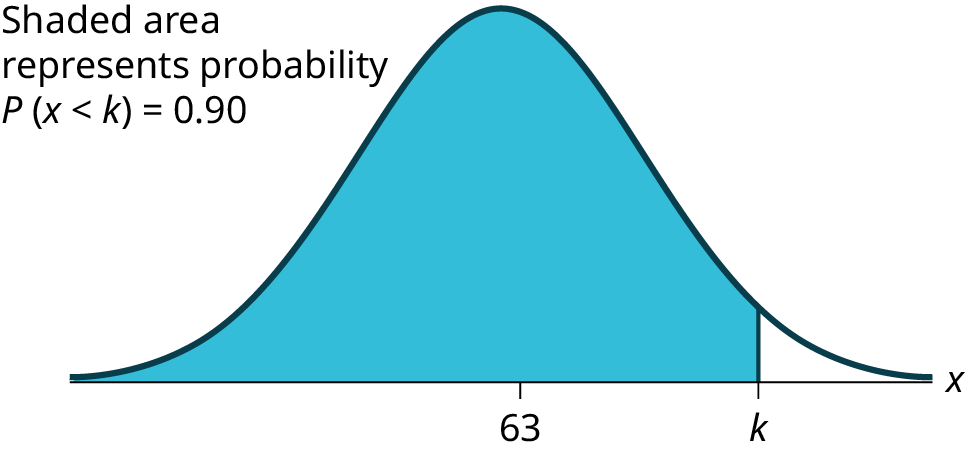
Figure 6.6図 6.6
The 90th percentile is 69.4. This means that 90% of the test scores fall at or below 69.4 and 10% fall at or above. To get this answer on the calculator, follow this step:
第90パーセンタイルは69.4である。これは、得点の90%が69.4以下、10%が69.4以上であることを意味する。電卓でこの答えを得るには、次の操作を行う。
Using the Calculator電卓の操作
d. Find the 70th percentile (that is, find the score k such that 70% of scores are below k and 30% of the scores are above k).
d. 第70パーセンタイルを求めよ。すなわち、得点の70%がkより低く、30%がkより高くなる得点kを求めよ。
Solution解き方
d. Find the 70th percentile.
d. 第70パーセンタイルを求める。
Draw a new graph and label it appropriately. k = 65.6
新しいグラフを描き、適切なラベルを付ける。k = 65.6。
The 70th percentile is 65.6. This means that 70% of the test scores fall at or below 65.5 and 30% fall at or above.
第70パーセンタイルは65.6である。これは、得点の70%が65.5以下、30%が65.5以上であることを意味する。
invNorm(0.70,63,5) = 65.6
Example 6.9例題 6.9
A personal computer is used for office work at home, research, communication, personal finances, education, entertainment, social networking, and a myriad of other things. Suppose that the average number of hours a household personal computer is used for entertainment is two hours per day. Assume the times for entertainment are normally distributed and the standard deviation for the times is half an hour.
英語のヒント
パソコンは、自宅での事務作業、調査、通信、家計管理、教育、娯楽、ソーシャルネットワークなど、数多くの用途に使われる。家庭のパソコンを娯楽に使う時間が、1日平均2時間であるとする。娯楽に使う時間は正規分布に従い、標準偏差は0.5時間と仮定する。
a. Find the probability that a household personal computer is used for entertainment between 1.8 and 2.75 hours per day.
a. 家庭のパソコンを娯楽に使う時間が、1日1.8〜2.75時間となる確率を求めよ。
Solution解き方
a. Let X = the amount of time (in hours) a household personal computer is used for entertainment. X ~ N(2, 0.5) where μ = 2 and σ = 0.5.
a. X = 家庭のパソコンを娯楽に使う時間(時間)とする。μ = 2、σ = 0.5なので、X ~ N(2, 0.5)である。
Find P(1.8 < x < 2.75).
P(1.8 < x < 2.75)を求める。
The probability for which you are looking is the area between x = 1.8 and x = 2.75. P(1.8 < x < 2.75) = 0.5886
英語のヒント
求める確率は、x = 1.8とx = 2.75の間の面積である。P(1.8 < x < 2.75) = 0.5886。
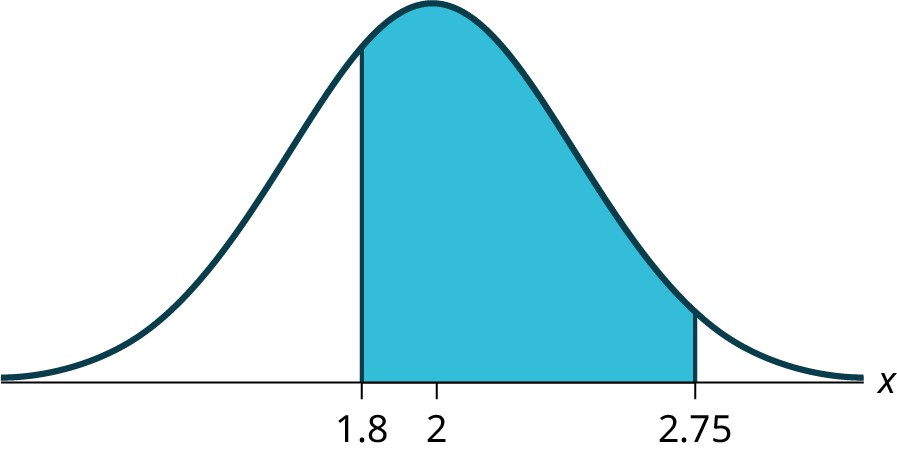
Figure 6.7図 6.7
normalcdf(1.8,2.75,2,0.5) = 0.5886
The probability that a household personal computer is used between 1.8 and 2.75 hours per day for entertainment is 0.5886.
家庭のパソコンを娯楽に使う時間が1日1.8〜2.75時間となる確率は、0.5886である。
b. Find the maximum number of hours per day that the bottom quartile of households uses a personal computer for entertainment.
b. 娯楽のためのパソコン利用時間が短いほうから4分の1に入る世帯について、1日当たりの利用時間の最大値を求めよ。
Solution解き方
b. To find the maximum number of hours per day that the bottom quartile of households uses a personal computer for entertainment, find the 25th percentile, k, where P(x < k) = 0.25.
b. 利用時間が短いほうから4分の1に入る世帯の、1日当たりの娯楽目的のパソコン利用時間の最大値を求めるには、P(x < k) = 0.25となる第25パーセンタイルkを求めればよい。
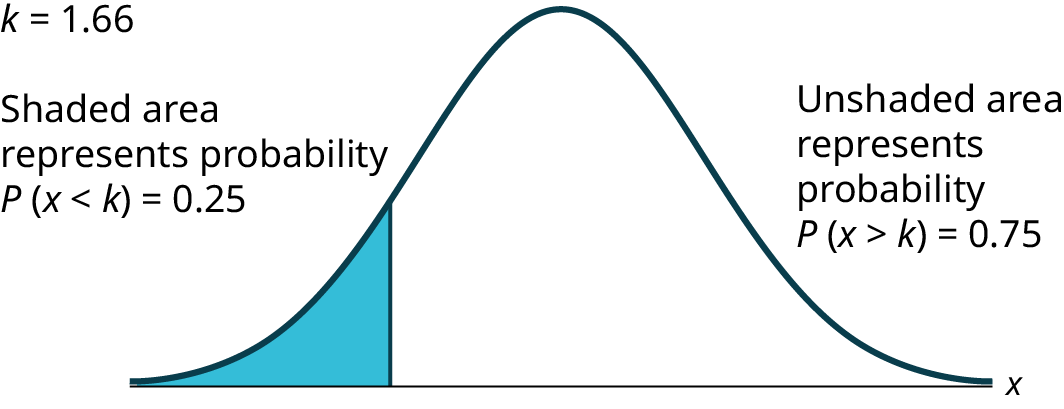
Figure 6.8図 6.8
invNorm(0.25,2,0.5) = 1.66
The maximum number of hours per day that the bottom quartile of households uses a personal computer for entertainment is 1.66 hours.
利用時間が短いほうから4分の1に入る世帯の、1日当たりの娯楽目的のパソコン利用時間の最大値は1.66時間である。
Example 6.10例題 6.10
In the United States the ages 13 to 55+ of smartphone users approximately follow a normal distribution with approximate mean and standard deviation of 36.9 years and 13.9 years, respectively.
米国の13歳から55歳以上までのスマートフォン利用者の年齢は、平均約36.9歳、標準偏差約13.9歳の正規分布にほぼ従う。
a. Determine the probability that a random smartphone user in the age range 13 to 55+ is between 23 and 64.7 years old.
a. 13歳から55歳以上までの年齢層から無作為に選んだスマートフォン利用者が、23〜64.7歳である確率を求めよ。
b. Determine the probability that a randomly selected smartphone user in the age range 13 to 55+ is at most 50.8 years old.
b. 13歳から55歳以上までの年齢層から無作為に選んだスマートフォン利用者が、50.8歳以下である確率を求めよ。
c. Find the 80th percentile of this distribution, and interpret it in a complete sentence.
c. この分布の第80パーセンタイルを求め、その意味を完全な文で説明せよ。
Solution解き方
a. normalcdf(23,64.7,36.9,13.9) = 0.8186
b. normalcdf(–1099,50.8,36.9,13.9) = 0.8413
c.
- invNorm(0.80,36.9,13.9) = 48.6
- The 80th percentile is 48.6 years.第80パーセンタイルは48.6歳である。
- 80% of the smartphone users in the age range 13 – 55+ are 48.6 years old or less.13歳から55歳以上までのスマートフォン利用者の80%は、48.6歳以下である。
Example 6.11例題 6.11
In the United States the ages 13 to 55+ of smartphone users approximately follow a normal distribution with approximate mean and standard deviation of 36.9 years and 13.9 years respectively. Using this information, answer the following questions (round answers to one decimal place).
米国の13歳から55歳以上までのスマートフォン利用者の年齢は、平均約36.9歳、標準偏差約13.9歳の正規分布にほぼ従う。この情報を使って次の問いに答えよ。答えは小数第1位までに丸める。
a. Calculate the interquartile range (IQR).
a. 四分位範囲(IQR)を計算せよ。
b. Forty percent of the smartphone users from 13 to 55+ are at least what age?
b. 13歳から55歳以上までのスマートフォン利用者の40%は、少なくとも何歳か。
Solution解き方
a.
- IQR = Q3 – Q1
- Calculate Q3 = 75th percentile and Q1 = 25th percentile.Q3 = 第75パーセンタイルと、Q1 = 第25パーセンタイルを計算する。
- invNorm(0.75,36.9,13.9) = Q3 = 46.2754
- invNorm(0.25,36.9,13.9) = Q1 = 27.5246
- IQR = Q3 – Q1 = 18.8
b.
- Find k where P(x ≥ k) = 0.40 ("At least" translates to "greater than or equal to.")P(x ≥ k) = 0.40となるkを求める。「少なくとも」は「それ以上」を意味する。
- 0.40 = the area to the right.0.40 = 右側の面積。
- Area to the left = 1 – 0.40 = 0.60.左側の面積 = 1 – 0.40 = 0.60。
- The area to the left of k = 0.60.kより左側の面積 = 0.60。
- invNorm(0.60,36.9,13.9) = 40.4215.invNorm(0.60,36.9,13.9) = 40.4215。
- k = 40.4.
- Forty percent of the smartphone users from 13 to 55+ are at least 40.4 years.13歳から55歳以上までのスマートフォン利用者の40%は、40.4歳以上である。
Example 6.12例題 6.12
A citrus farmer who grows mandarin oranges finds that the diameters of mandarin oranges harvested on his farm follow a normal distribution with a mean diameter of 5.85 cm and a standard deviation of 0.24 cm.
英語のヒント
マンダリンオレンジを栽培するある柑橘農家は、農園で収穫するオレンジの直径が、平均5.85 cm、標準偏差0.24 cmの正規分布に従うことを知った。
a. Find the probability that a randomly selected mandarin orange from this farm has a diameter larger than 6.0 cm. Sketch the graph.
a. この農園から無作為に選んだマンダリンオレンジの直径が6.0 cmより大きい確率を求めよ。グラフの概形を描け。
b. The middle 20% of mandarin oranges from this farm have diameters between ______ and ______.
b. この農園のマンダリンオレンジの中央20%の直径は、______と______の間にある。
c. Find the 90th percentile for the diameters of mandarin oranges, and interpret it in a complete sentence.
c. マンダリンオレンジの直径の第90パーセンタイルを求め、その意味を完全な文で説明せよ。
Solution解き方
a. normalcdf(6,10^99,5.85,0.24) = 0.2660
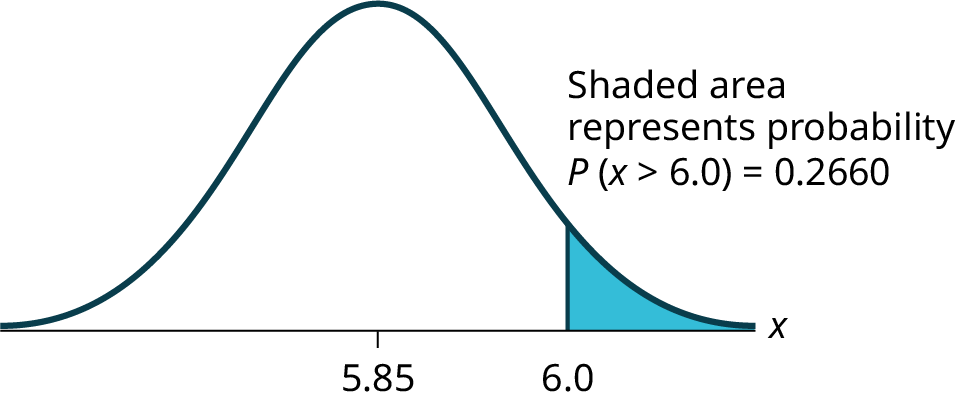


Figure 6.9図 6.9
b.
- 1 – 0.20 = 0.80
- The tails of the graph of the normal distribution each have an area of 0.40.正規分布のグラフの左右の裾は、それぞれ面積0.40である。
- Find k1, the 40th percentile, and k2, the 60th percentile (0.40 + 0.20 = 0.60).第40パーセンタイルk1と、第60パーセンタイルk2を求める(0.40 + 0.20 = 0.60)。
- k1 = invNorm(0.40,5.85,0.24) = 5.79 cm
- k2 = invNorm(0.60,5.85,0.24) = 5.91 cm
c. 6.16: Ninety percent of the diameter of the mandarin oranges is at most 6.16 cm.
c. 6.16。マンダリンオレンジの90%は、直径が6.16 cm以下である。