第2章記述統計
Introductionはじめに
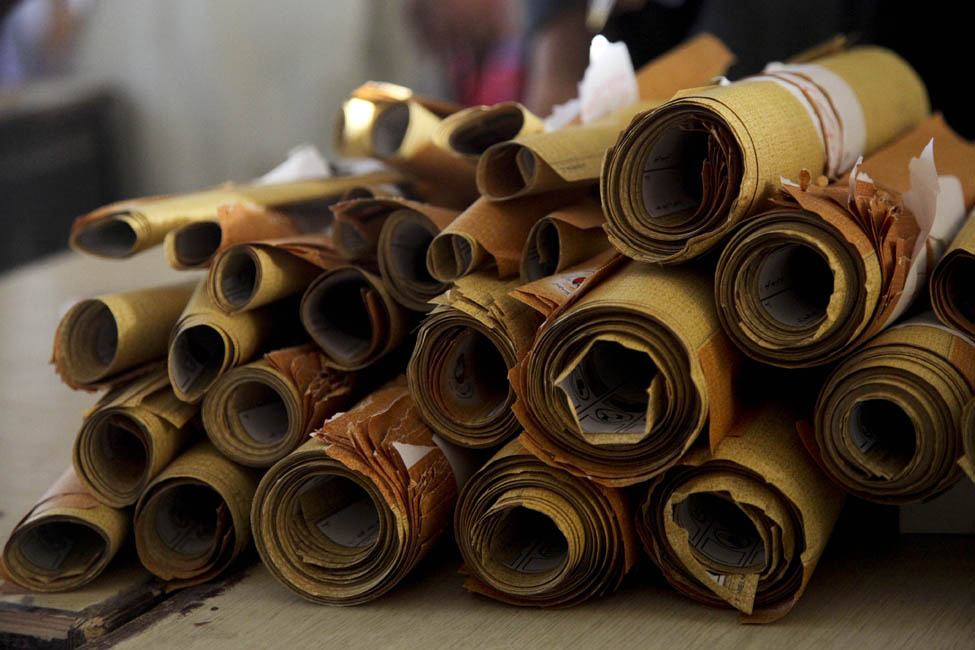
credit: modification of work “HELMAND PROVINCE, Afghanistan (Aug. 21, 2009) Voting ballots organized and arranged for counting by Afghan presidential election workers at a local school in the Nawa District.” by U.S. Marine Corps photo by Staff Sgt. William Greeson/ Wikimedia Commons, Public Domain · Public domain (stated in original image credit) · Source出典
Figure 2.1図 2.1
When you have large amounts of data, you will need to organize it in a way that makes sense. These ballots from an election are rolled together with similar ballots to keep them organized. (credit: modification of work “HELMAND PROVINCE, Afghanistan (Aug. 21, 2009) Voting ballots organized and arranged for counting by Afghan presidential election workers at a local school in the Nawa District.” by U.S. Marine Corps photo by Staff Sgt. William Greeson/ Wikimedia Commons, Public Domain)
大量のデータは、意味が分かるように整理する必要がある。この選挙の投票用紙は、同種の用紙を一緒に巻いて整理している。(クレジット:米海兵隊William Greeson二等軍曹撮影「アフガニスタン・ヘルマンド州、2009年8月21日。ナワ地区の学校で、アフガニスタン大統領選の職員が開票用に整理・配置した投票用紙」を改変。Wikimedia Commons、パブリックドメイン)
Once you have collected data, what will you do with it? Data can be described and presented in many different formats. For example, suppose you are interested in buying a house in a particular area. You may have no clue about the house prices, so you might ask your real estate agent to give you a sample data set of prices. Looking at all the prices in the sample often is overwhelming. A better way might be to look at the median price and the variation of prices. The median and variation are just two ways that you will learn to describe data. Your agent might also provide you with a graph of the data.
英語のヒント
データを集めたら、次に何をするだろうか。データの記述や提示には、さまざまな形式がある。例えば、ある地域で家を買いたいとする。相場が全く分からなければ、不動産業者に価格の標本データを見せてもらうかもしれない。標本に含まれる価格をすべて眺めても、途方に暮れることが多い。価格の中央値やばらつきを見る方がよいかもしれない。中央値とばらつきは、これから学ぶデータの記述方法のうちの2つである。業者がデータのグラフも示してくれるかもしれない。
In this chapter, you will study numerical and graphical ways to describe and display your data. This area of statistics is called "Descriptive Statistics." You will learn how to calculate, and even more importantly, how to interpret these measurements and graphs.
この章では、数値とグラフでデータを記述・表示する方法を学ぶ。この統計学の分野を「記述統計学」という。指標の計算方法に加え、さらに重要な、指標とグラフの解釈の仕方を学ぶ。
A statistical graph is a tool that helps you learn about the shape or distribution of a sample or a population. A graph can be a more effective way of presenting data than a mass of numbers because we can see where data clusters and where there are only a few data values. Newspapers and the Internet use graphs to show trends and to enable readers to compare facts and figures quickly. Statisticians often graph data first to get a picture of the data. Then, more formal tools may be applied.
英語のヒント
統計グラフは、標本や母集団の形、すなわち分布を知るための道具である。数値の羅列よりも、グラフの方がデータを効果的に示せることがある。どこにデータが集まり、どこに少ないかが見えるからである。新聞やインターネットでは、傾向を示し、読者が事実や数値をすばやく比較できるようにグラフを使う。統計家はしばしば、まずデータを図示して全体像をつかみ、その後でより形式的な手法を適用する。
Some of the types of graphs that are used to summarize and organize data are the dot plot, the bar graph, the histogram, the stem-and-leaf plot, the frequency polygon (a type of broken line graph), the pie chart, and the box plot. In this chapter, we will briefly look at stem-and-leaf plots, line graphs, and bar graphs, as well as frequency polygons, and time series graphs.
データを要約・整理するグラフには、ドットプロット、棒グラフ、ヒストグラム、幹葉図、度数折れ線(折れ線グラフの一種)、円グラフ、箱ひげ図などがある。この章では、幹葉図、折れ線グラフ、棒グラフに加え、度数折れ線や時系列グラフも簡単に扱う。