第2章記述統計
2.1 Stem-and-Leaf Graphs (Stemplots), Line Graphs, and Bar Graphs2.1 幹葉図、折れ線グラフ、棒グラフ
One simple graph, the stem-and-leaf graph or stemplot, comes from the field of exploratory data analysis. It is a good choice when the data sets are small. To create the plot, divide each observation of data into a stem and a leaf. The leaf consists of a final significant digit. For example, 23 has stem two and leaf three. The number 432 has stem 43 and leaf two. Likewise, the number 5,432 has stem 543 and leaf two. The decimal 9.3 has stem nine and leaf three. Write the stems in a vertical line from smallest to largest. Draw a vertical line to the right of the stems. Then write the leaves in increasing order next to their corresponding stem.
英語のヒント
単純なグラフの1つである幹葉図は、探索的データ分析の分野から生まれた。データセットが小さい場合に適している。作成するには、各観測値を「幹」と「葉」に分ける。葉は、最後の有効な1桁である。例えば、23なら幹は2、葉は3となる。432なら幹は43、葉は2である。同様に、5,432なら幹は543、葉は2である。小数9.3なら幹は9、葉は3である。幹を小さい順に縦に並べ、その右側に縦線を引く。次に、対応する幹の横に、葉を小さい順に書き込む。
Example 2.1例題 2.1
For Professor Dean's spring pre-calculus class, scores for the first exam were as follows (smallest to largest):
33; 42; 49; 49; 53; 55; 55; 61; 63; 67; 68; 68; 69; 69; 72; 73; 74; 78; 80; 83; 88; 88; 88; 90; 92; 94; 94; 94; 94; 96; 100
33; 42; 49; 49; 53; 55; 55; 61; 63; 67; 68; 68; 69; 69; 72; 73; 74; 78; 80; 83; 88; 88; 88; 90; 92; 94; 94; 94; 94; 96; 100
ディーン教授の春学期の微積分準備の授業で、最初の試験の点数は次のとおりだった(小さい順)。33; 42; 49; 49; 53; 55; 55; 61; 63; 67; 68; 68; 69; 69; 72; 73; 74; 78; 80; 83; 88; 88; 88; 90; 92; 94; 94; 94; 94; 96; 100
Stem 幹 |
Leaf 葉 |
|---|---|
3 |
3 |
4 |
2 9 9 |
5 |
3 5 5 |
6 |
1 3 7 8 8 9 9 |
7 |
2 3 4 8 |
8 |
0 3 8 8 8 |
9 |
0 2 4 4 4 4 6 |
10 |
0 |
The stemplot shows that most scores fell in the 60s, 70s, 80s, and 90s. Eight out of the 31 scores or approximately 26% were in the 90s or 100, a fairly high number of As.
幹葉図から、点数の大部分が60点台、70点台、80点台、90点台だったと分かる。31人中8人、つまり約26% が90点台か100点であり、A評価がかなり多い。
The stemplot is a quick way to graph data and gives an exact picture of the data. You want to look for an overall pattern and any outliers. An outlier is an observation of data that does not fit the rest of the data. It is sometimes called an extreme value. When you graph an outlier, it will appear not to fit the pattern of the graph. Some outliers are due to mistakes (for example, writing down 50 instead of 500) while others may indicate that something unusual is happening. It takes some background information to explain outliers, so we will cover them in more detail later.
英語のヒント
幹葉図は、すばやくデータを図示し、その正確な姿を示す方法である。全体的なパターンと外れ値に着目する。外れ値とは、ほかのデータになじまない観測値であり、極端値ともいう。外れ値を図にすると、そのグラフのパターンから外れて見える。500と書くべきところを50と書くような間違いによる外れ値もあれば、何か異常が起きていることを示す外れ値もある。外れ値の説明には背景情報が必要なので、後で詳しく扱う。
Example 2.2例題 2.2
The data are the distances (in kilometers) from a home to local supermarkets. Create a stemplot using the data:
1.1; 1.5; 2.3; 2.5; 2.7; 3.2; 3.3; 3.3; 3.5; 3.8; 4.0; 4.2; 4.5; 4.5; 4.7; 4.8; 5.5; 5.6; 6.5; 6.7; 12.3
1.1; 1.5; 2.3; 2.5; 2.7; 3.2; 3.3; 3.3; 3.5; 3.8; 4.0; 4.2; 4.5; 4.5; 4.7; 4.8; 5.5; 5.6; 6.5; 6.7; 12.3
データは、ある家から近隣のスーパーまでの距離(キロメートル)である。次のデータで幹葉図を作成せよ。1.1; 1.5; 2.3; 2.5; 2.7; 3.2; 3.3; 3.3; 3.5; 3.8; 4.0; 4.2; 4.5; 4.5; 4.7; 4.8; 5.5; 5.6; 6.5; 6.7; 12.3
Do the data seem to have any concentration of values?
値が集中しているところはありそうか。
Solution解き方
The value 12.3 may be an outlier. Values appear to concentrate at three and four kilometers.
12.3は外れ値かもしれない。値は3~4キロメートル付近に集中しているようである。
Stem 幹 |
Leaf 葉 |
|---|---|
1 |
1 5 |
2 |
3 5 7 |
3 |
2 3 3 5 8 |
4 |
0 2 5 5 7 8 |
5 |
5 6 |
6 |
5 7 |
7 |
|
8 |
|
9 |
|
10 |
|
11 |
|
12 |
3 |
Example 2.3例題 2.3
A side-by-side stem-and-leaf plot allows a comparison of the two data sets in two columns. In a side-by-side stem-and-leaf plot, two sets of leaves share the same stem. The leaves are to the left and the right of the stems. Table 2.3 and Table 2.4 show the ages of presidents at their inauguration and at their death. Construct a side-by-side stem-and-leaf plot using this data.
英語のヒント
President 大統領 |
Age 年齢 |
President 大統領 |
Age 年齢 |
President 大統領 |
Age 年齢 |
|---|---|---|---|---|---|
Washington ワシントン |
57 |
Lincoln リンカーン |
52 |
Hoover フーヴァー |
54 |
J. Adams J・アダムズ |
61 |
A. Johnson A・ジョンソン |
56 |
F. Roosevelt F・ルーズベルト |
51 |
Jefferson ジェファソン |
57 |
Grant グラント |
46 |
Truman トルーマン |
60 |
Madison マディソン |
57 |
Hayes ヘイズ |
54 |
Eisenhower アイゼンハワー |
62 |
Monroe モンロー |
58 |
Garfield ガーフィールド |
49 |
Kennedy ケネディ |
43 |
J. Q. Adams J・Q・アダムズ |
57 |
Arthur アーサー |
51 |
L. Johnson L・ジョンソン |
55 |
Jackson ジャクソン |
61 |
Cleveland クリーブランド |
47 |
Nixon ニクソン |
56 |
Van Buren ヴァン・ビューレン |
54 |
B. Harrison B・ハリソン |
55 |
Ford フォード |
61 |
W. H. Harrison W・H・ハリソン |
68 |
Cleveland クリーブランド |
55 |
Carter カーター |
52 |
Tyler タイラー |
51 |
McKinley マッキンリー |
54 |
Reagan レーガン |
69 |
Polk ポーク |
49 |
T. Roosevelt T・ルーズベルト |
42 |
G.H.W. Bush G・H・W・ブッシュ |
64 |
Taylor テイラー |
64 |
Taft タフト |
51 |
Clinton クリントン |
47 |
Fillmore フィルモア |
50 |
Wilson ウィルソン |
56 |
G. W. Bush G・W・ブッシュ |
54 |
Pierce ピアース |
48 |
Harding ハーディング |
55 |
Obama オバマ |
47 |
Buchanan ブキャナン |
65 |
Coolidge クーリッジ |
51 |
President 大統領 |
Age 年齢 |
President 大統領 |
Age 年齢 |
President 大統領 |
Age 年齢 |
|---|---|---|---|---|---|
Washington ワシントン |
67 |
Lincoln リンカーン |
56 |
Hoover フーヴァー |
90 |
J. Adams J・アダムズ |
90 |
A. Johnson A・ジョンソン |
66 |
F. Roosevelt F・ルーズベルト |
63 |
Jefferson ジェファソン |
83 |
Grant グラント |
63 |
Truman トルーマン |
88 |
Madison マディソン |
85 |
Hayes ヘイズ |
70 |
Eisenhower アイゼンハワー |
78 |
Monroe モンロー |
73 |
Garfield ガーフィールド |
49 |
Kennedy ケネディ |
46 |
J. Q. Adams J・Q・アダムズ |
80 |
Arthur アーサー |
56 |
L. Johnson L・ジョンソン |
64 |
Jackson ジャクソン |
78 |
Cleveland クリーブランド |
71 |
Nixon ニクソン |
81 |
Van Buren ヴァン・ビューレン |
79 |
B. Harrison B・ハリソン |
67 |
Ford フォード |
93 |
W. H. Harrison W・H・ハリソン |
68 |
Cleveland クリーブランド |
71 |
Reagan レーガン |
93 |
Tyler タイラー |
71 |
McKinley マッキンリー |
58 |
||
Polk ポーク |
53 |
T. Roosevelt T・ルーズベルト |
60 |
||
Taylor テイラー |
65 |
Taft タフト |
72 |
||
Fillmore フィルモア |
74 |
Wilson ウィルソン |
67 |
||
Pierce ピアース |
64 |
Harding ハーディング |
57 |
||
Buchanan ブキャナン |
77 |
Coolidge クーリッジ |
60 |
Solution解き方
Ages at Inauguration 就任時の年齢 |
Ages at Death 死亡時の年齢 |
|
|---|---|---|
9 9 8 7 7 7 6 3 2 |
4 |
6 9 |
8 7 7 7 7 6 6 6 5 5 5 5 4 4 4 4 4 2 2 1 1 1 1 1 0 |
5 |
3 6 6 7 7 8 |
9 8 5 4 4 2 1 1 1 0 |
6 |
0 0 3 3 4 4 5 6 7 7 7 8 |
7 |
0 1 1 1 2 3 4 7 8 8 9 |
|
8 |
0 1 3 5 8 |
|
9 |
0 0 3 3 |
Another type of graph that is useful for specific data values is a line graph. In the particular line graph shown in Example 2.4, the x-axis (horizontal axis) consists of data values and the y-axis (vertical axis) consists of frequency points. The frequency points are connected using line segments.
個々のデータの値を表すのに役立つ別のグラフに、折れ線グラフがある。例題2.4の折れ線グラフでは、x軸(横軸)にデータの値、y軸(縦軸)に度数を取って点を打つ。それらの点を線分で結ぶ。
Example 2.4例題 2.4
In a survey, 40 parents were asked how many times per week a teenager must be reminded to do their chores. The results are shown in Table 2.7 and in Figure 2.2.
英語のヒント
Number of times teenager is reminded 10代の子どもに注意する回数 |
Frequency 度数 |
|---|---|
0 |
2 |
1 |
5 |
2 |
8 |
3 |
14 |
4 |
7 |
5 |
4 |
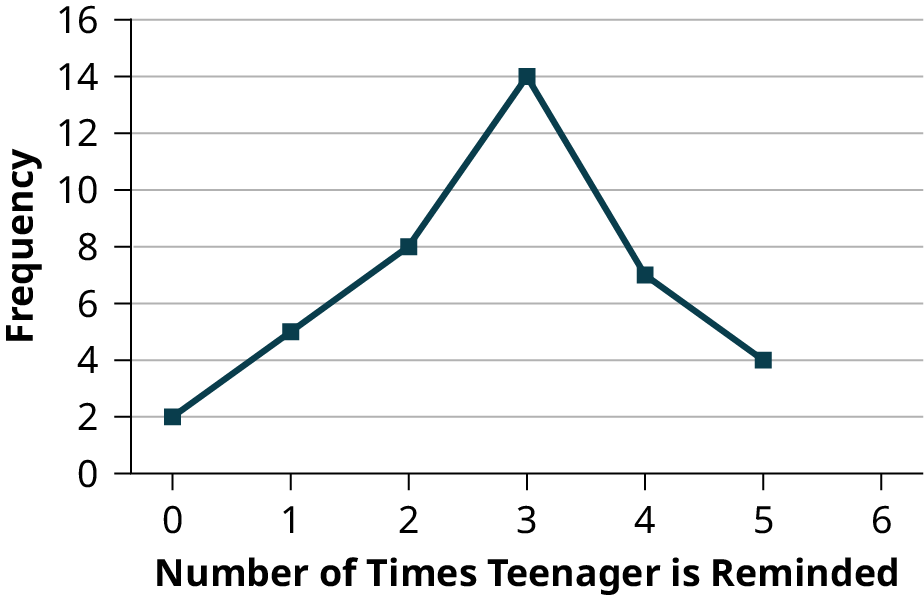
Figure 2.2図 2.2
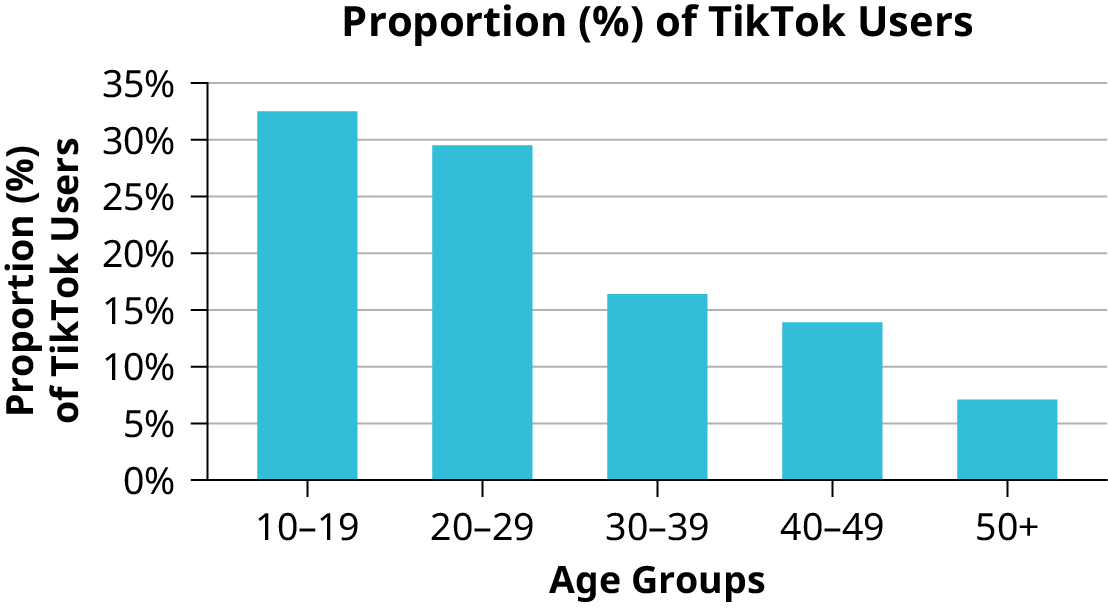
Bar graphs consist of bars that are separated from each other. The bars can be rectangles or they can be rectangular boxes (used in three-dimensional plots), and they can be vertical or horizontal. The bar graph shown in Example 2.5 has age groups represented on the x-axis and proportions on the y-axis.
英語のヒント
棒グラフは、互いに離れた棒からなる。棒は長方形、または立体的な図の場合には直方体であり、縦向きにも横向きにもできる。例題2.5の棒グラフは、x軸に年齢層、y軸に割合を示す。
Example 2.5例題 2.5
Example 2.6例題 2.6
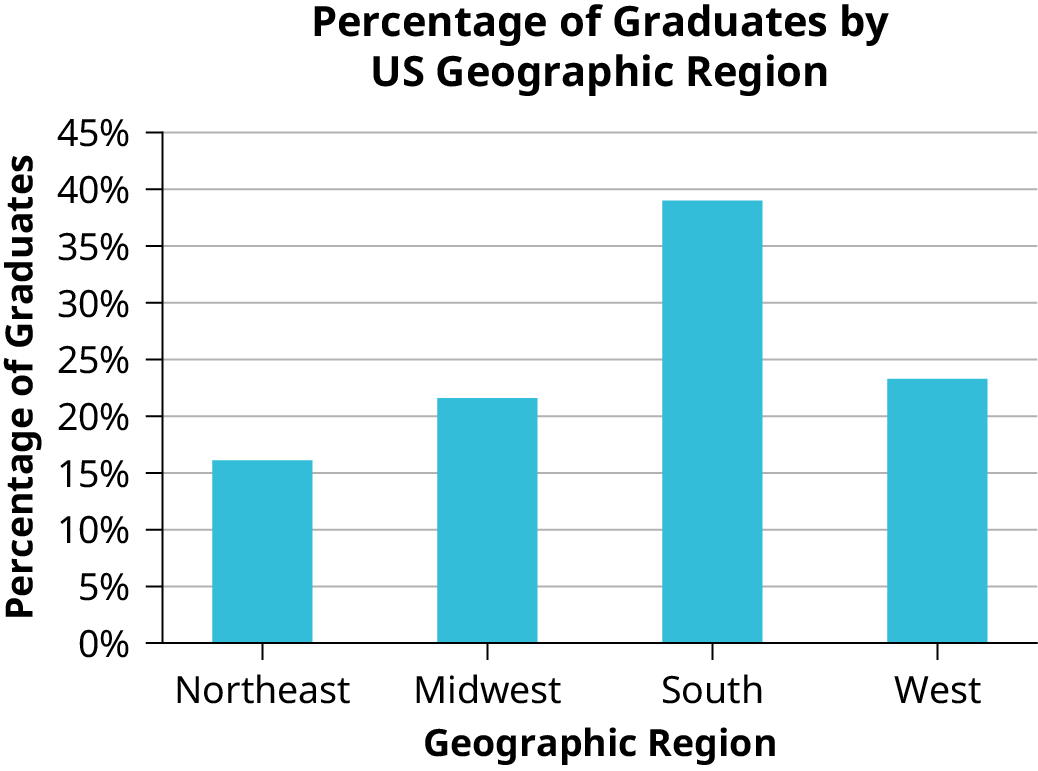
The columns in Table 2.11 show the projected data for the year 2030 for the number and percentages of high school graduates by geographic region in the United States. Create a bar graph for this data with the geographic region (qualitative data) on the x-axis and the percentage of high school data (quantitative data) on the y-axis.
表2.11の各列は、2030年の米国の高校卒業者数と百分率の予測を地域別に示す。このデータについて、x軸に地域(質的データ)、y軸に高校卒業者の百分率(量的データ)を取った棒グラフを作成せよ。
Region 地域 |
Number of Graduates 卒業者数 |
Percentage of Graduates 卒業者の百分率 |
|---|---|---|
Northeast 北東部 |
517,720 |
16.1% |
Midwest 中西部 |
695,170 |
21.6% |
South 南部 |
1,253,540 |
39.0% |
West 西部 |
749,400 |
23.3% |